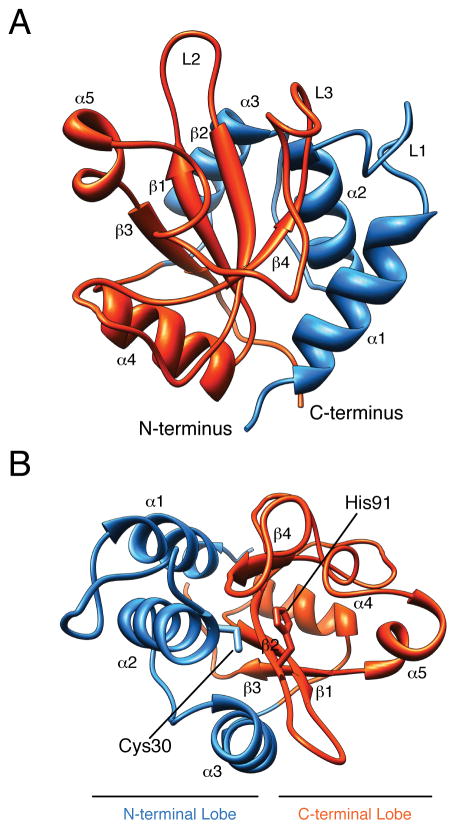
Figure 1. Overall structure of Tse1.
(A) Ribbon diagram showing the overall structure of Tse1. Secondary elements referred to in the text are labeled. (B) Top-down view of the Tse1 active site. The active site cleft is formed by the N- and C-terminal lobes, with catalytic residues Cys30 and His91 positioned at the N-terminal ends of α2 and β2. See also Figure S1.

