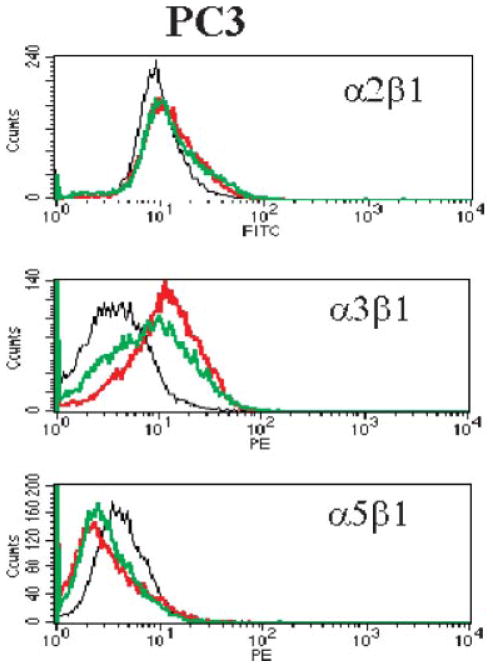
Fig. 2.
Specific amino acid deprivation modulates the expression of surface integrin molecules in PC3 cells. Specific culture and staining conditions are described in Materials and Methods Section. Cells were suspended and stained with fluorescently labeled anti-integrin antibodies. Twenty thousand events for each sample were collected by and analyzed. The X axis represents the density of fluorescence. The Y axis represents the cell count. Black line: cells cultured in complete medium; red line: cells cultured in Tyr/Phe-deprived medium; green line: cells cultured in Met-deprived medium. [Color figure can be viewed in the online issue, which is available at www.interscience.wiley.com.]

