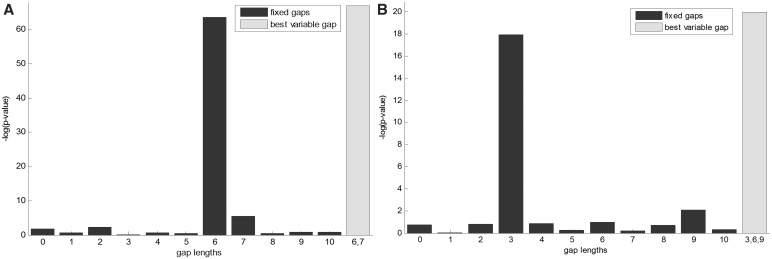
Figure 3.
TP53 and ESR1 motif analysis. (A) Eleven motifs having the pattern CATG-Nl-CATG, where 0 ≤ l ≤ 10, were tested (dark bars) and compared to the motif CATG-N6,7-CATG (rightmost bar), for TP53-binding data. (B) Eleven motifs having the pattern GTCA-Nl-TGAC, where 0 ≤ l ≤ 10, were tested (dark bars) and compared to the motif GTCA-N3,6,9-TGAC (rightmost bar), for ESR1-binding data.

