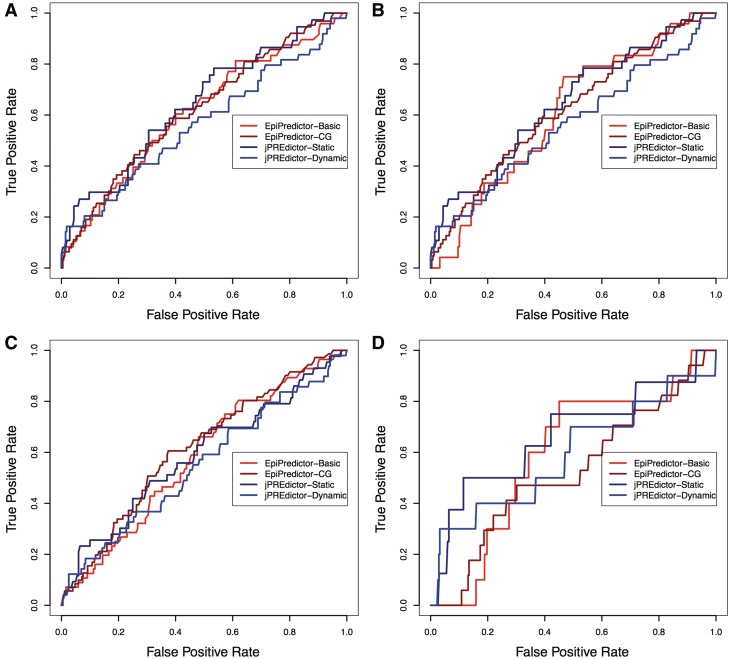
Figure 2.
ROC curves of the PRE genes predicted by EpiPredictor and jPREdictor. Shown are overlaps with the genes predicted by Schwartz et al. (A), Tolhuis et al. (B), Schuettengruber et al. (C) and the genes intersected by all three sets (D). The AUCs on the four validation sets are 0.61, 0.61, 0.58 and 0.60, respectively, for EpiPredictor-Basic, 0.62, 0.57, 0.62 and 0.53, respectively, for EpiPredictor-CG, 0.64, 0.56, 0.59 and 0.67 for jPREdictor (static), 0.56, 0.49, 0.55 and 0.59 for jPREdictor (dynamic).

