Figure 2.
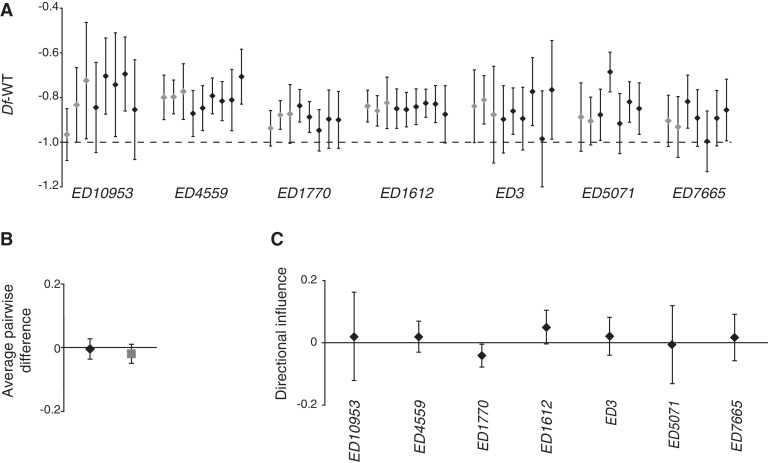
Buffering is not affected by combinatorial effects. (A) Mean expression ratio (log2 scale) for each deficiency region and replicate. Each deficiency region was present in 7–9 replicates and the replicates of the Df/+ when single and when paired with another Df/+ are indicated in grey and black, respectively. The dashed line represents −1 in log2 scale or 50% of wild-type expression level. (B) Average directional effects on expression levels when more strongly buffered Df/+ were combined with less buffered Df/+ (black diamonds) and when less buffered Df/+ were combined with more strongly buffered Df/+ (grey square); mean values for 19 combinations. (C) Influence on expression ratio of single Df. The plot shows the influential effect of each Df when paired (none of the directional influences are significantly different from 0, Bonferroni-corrected Wilcoxon matched pair test). All y-axis values are in log2 scale. Whiskers indicate 95% confidence intervals (CIs).

