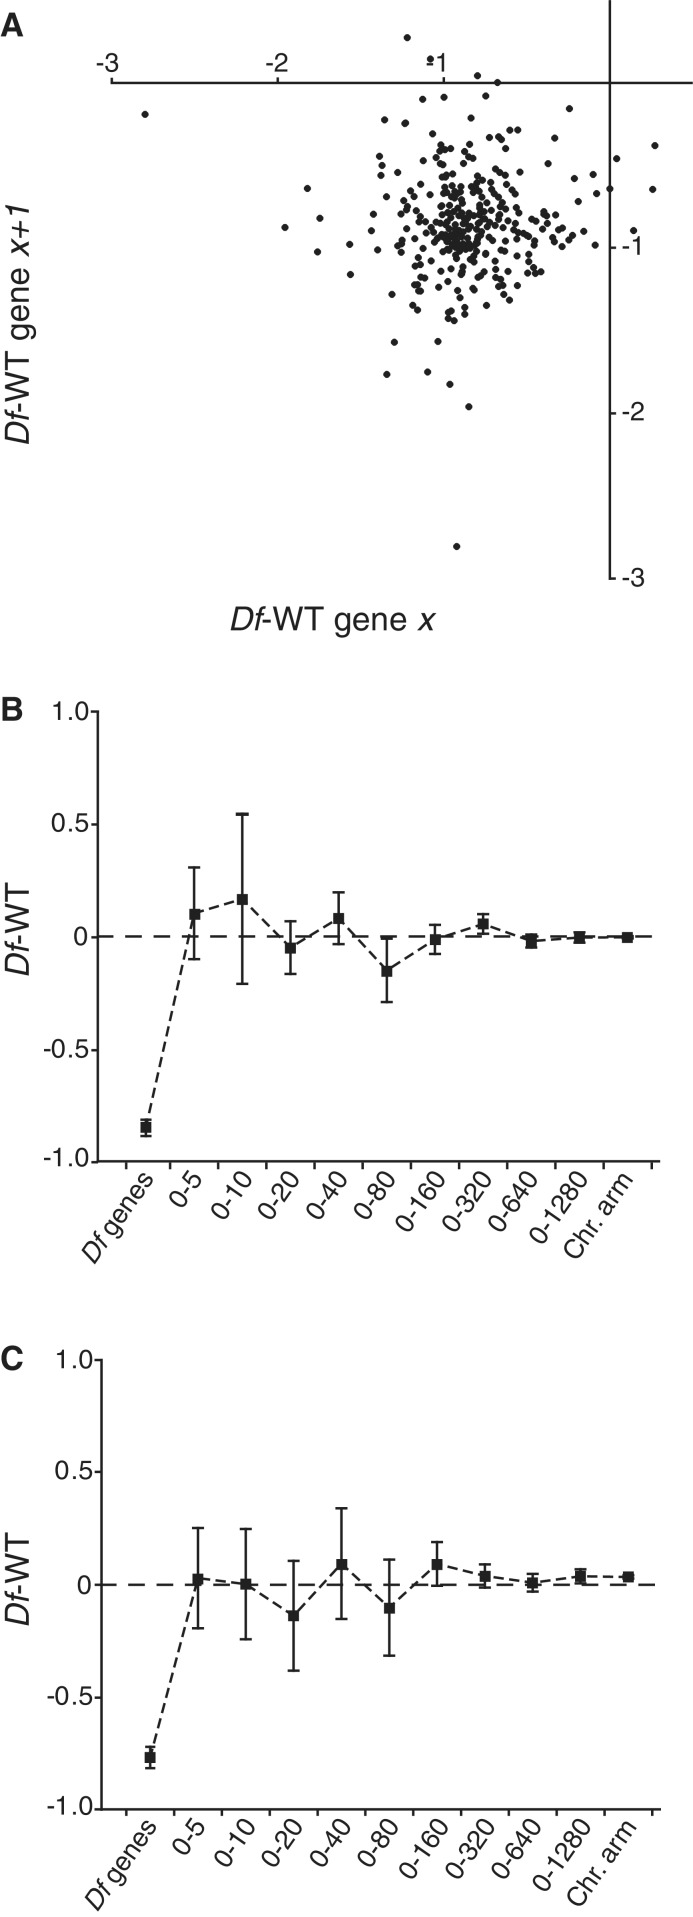
Figure 5.
Buffering level of one gene does not affect buffering of neighbouring genes. (A) Correlation plot of median expression ratio for each monosomic gene against the median expression ratio of neighbouring expressed monosomic genes. (B,C) Expression ratios of diploid genes within different interval distances (in kb) from a deficiency breakpoint. ‘Df genes’ represents the mean expression ratio of all genes uncovered by any deficiency. ‘Chr. arm’ represents the mean expression ratio of all diploid genes on the same chromosome arm as the deficiency. In (B) and (C) the mean expression ratio for each group was calculated using data for all diploid genes present within the interval and all long genes (>3 kb) within the interval, respectively. The dashed line represents 0 in log2 scale or no change from wild-type expression level. Squares indicate mean values and whiskers indicate 95% CI.

