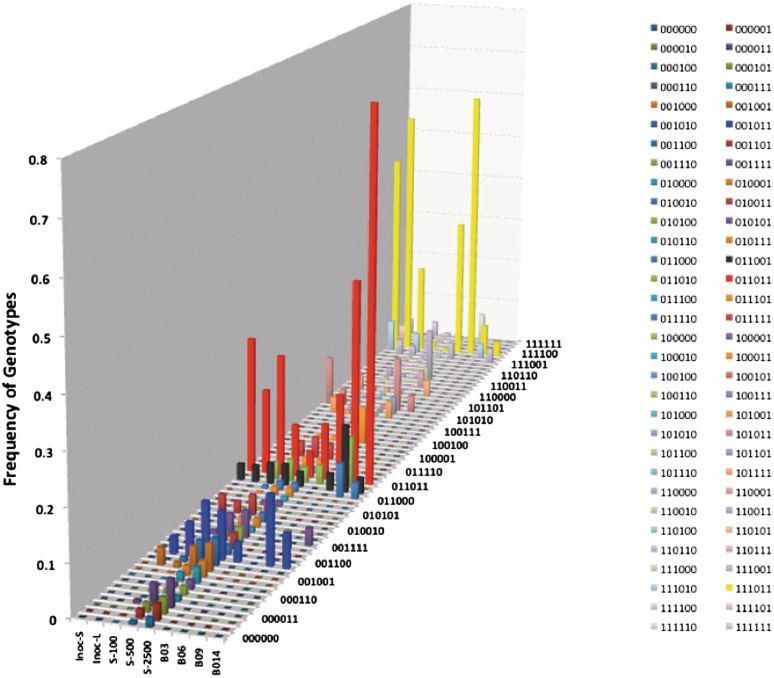
Figure 7.
Comparison of the changes in proportions of phase variable genotypes for theoretical and experimental in vivo passaged populations of strain 81–176. The proportions of genotypes for the inoculum were used as input to the theoretical model of PV, which was then run for a varying number of generations. Genotypes were for the six genes with 0 representing an OFF phase variant and 1 an ON variant. The order of the genes and the ON-to-OFF and OFF-to-ON switching rates (×10−4) were as follows: 81176-0083, 38.8, 3.7; 81176-0646, 17.9, 10.3; 81176-0708, 10.3, 17.9; 81176-1160, 17.9, 10.3; 81176-1312, 10.3, 17.9; 81176-1325, 10.3, 17.9. Inoc-S, small colonies in inoculum; Inoc-L, large colonies in inoculum; S-100, S-500 and S-2500 are output data from the model for runs of 100, 500 and 2500 generations using Inoc-S as the input to the model; B03, B06, B09 and B014 are experimental data for output populations obtained from four different chickens.

