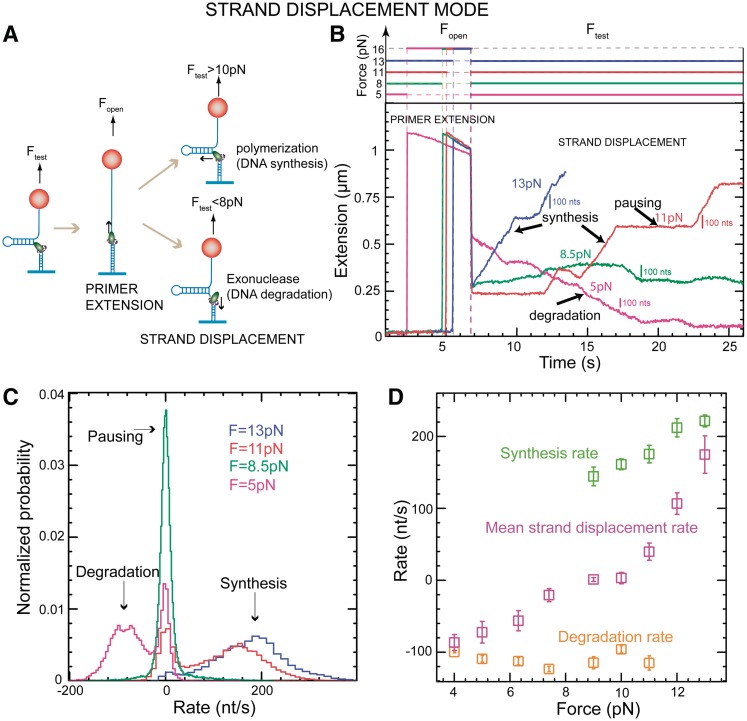
Figure 2.
Strand displacement activity of the wt T4 holoenzyme. (A) Schematic representation of the experimental protocol. Primer synthesis was initiated with the hairpin open at Fopen = 16 pN; the force was then lowered to various Ftest values and strand displacement activity was observed. (B) Traces of strand displacement activity recorded at Ftest values of 13 pN (blue), 11 pN (red), 8.5 pN (green) and 5 pN (magenta). Bars show the extension change corresponding to the synthesis or degradation of 100 nt. (C) Velocity distributions of instantaneous enzyme rates measured during strand displacement activity at different forces (colours as in panel B). The number of molecules (Nmol) analysed was 9, 14, 21 and 15 for 13, 11, 8.5 and 5 pN cases resulting in 82, 131, 115 and 224 number of enzymatic traces (N), respectively. (D) The mean synthesis rate  (light green), mean degradation rate
  (orange) and mean strand displacement rate
  (purple) measured for the wt T4 holoenzyme shown as a function of the applied force. Error bars are the s.e.m. The number of molecules and enzymatic traces analysed varies between Nmol = 9–27 and N = 75–253, respectively, depending on the condition.

