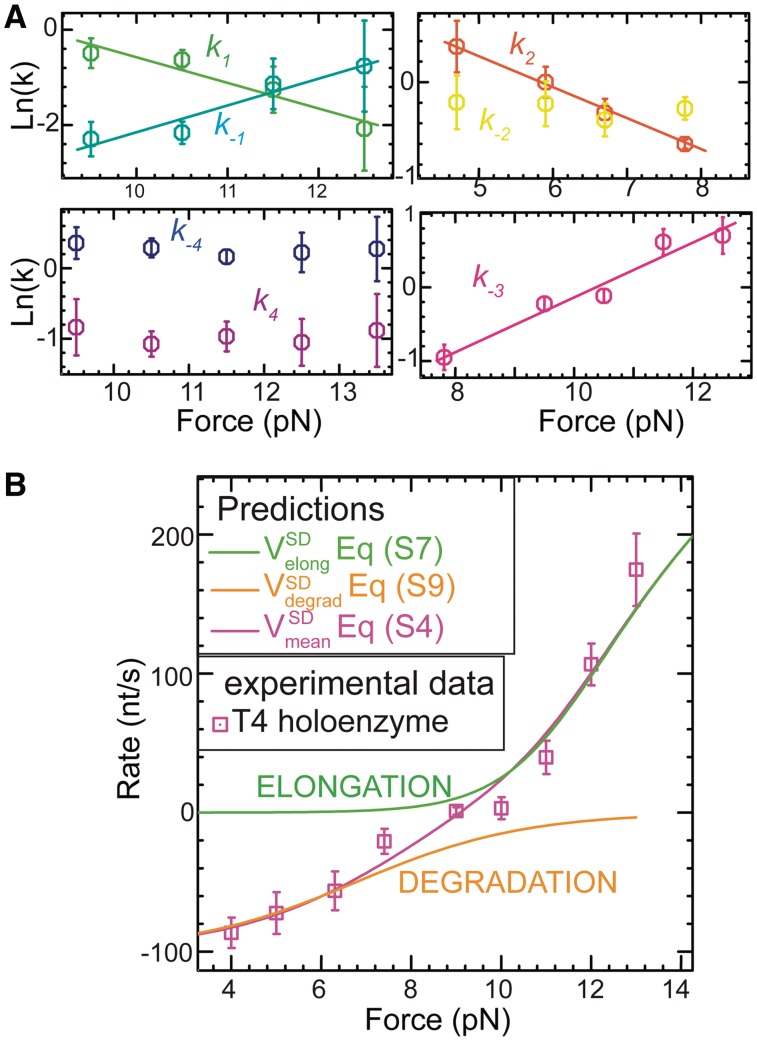
Figure 5.
Predictions from the kinetic model. (A) Kinetic rates (as shown in Figure 4A) estimated from the measurements of the state frequencies and mean lifetime of each state using Equation (S11). Error bars are obtained by propagating the errors associated with the mean lifetime and state frequencies. (B) A comparison of the measured mean strand displacement rate for the wt T4 holoenzyme (purple squares) to the predicted rates for the elongation (green line) and degradation (orange line) branches as estimated from Equations (S7) and (S9) and for the whole kinetic scheme including the two branches (magenta line) as estimated from Equation (S4) shown as a function of the applied force. Error bars are the s.e.m.

