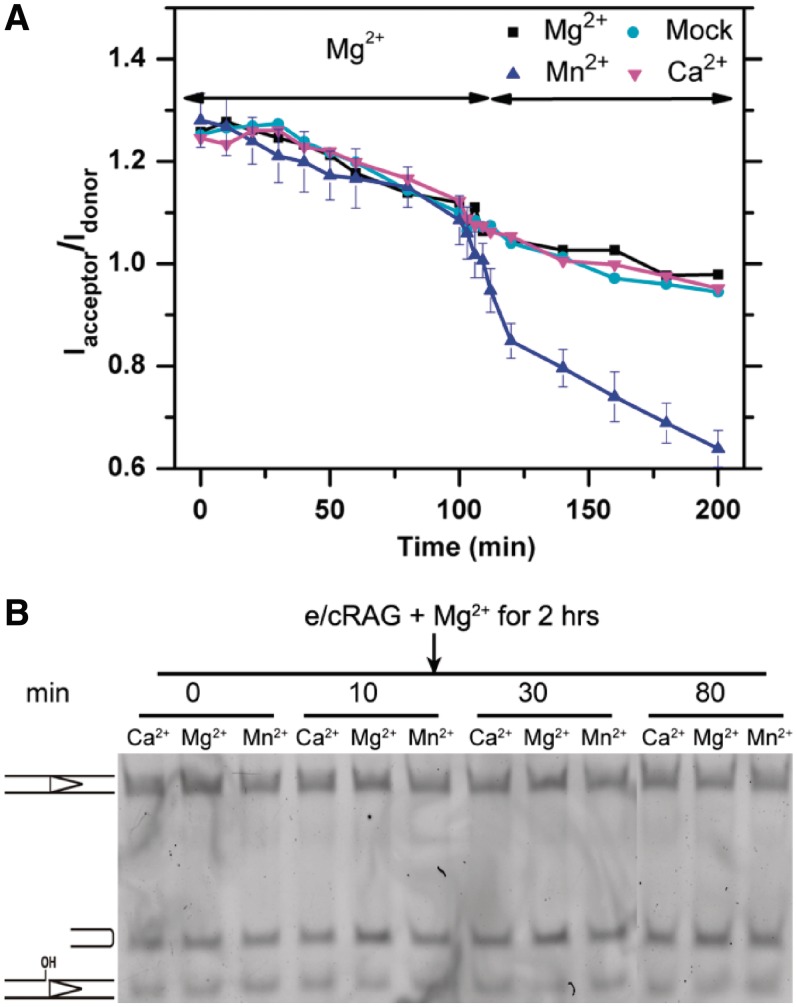
Figure 3.
The influence of HP-CE release by different cations. (A) FRET changes over the course of cation addition. The reaction was initiated with e/cRAG in Mg2+ and incubated for 2 h, after which Mg2+ (black), Ca2+ (magenta) or Mn2+ (blue) were added. A mock treatment is shown in cyan. (B). Denaturing gel electrophroresis analysis of HP-CE production after the step-wise addition of different cations. The different bands (from top to bottom) represent the intact RSS, hairpin and nicked DNA. All reactions were initiated by e/cRAG in Mg2+ and incubated for 2 h, after which the different cations described in the figure were added to the reaction. The times represent the incubation time after cation addition.

