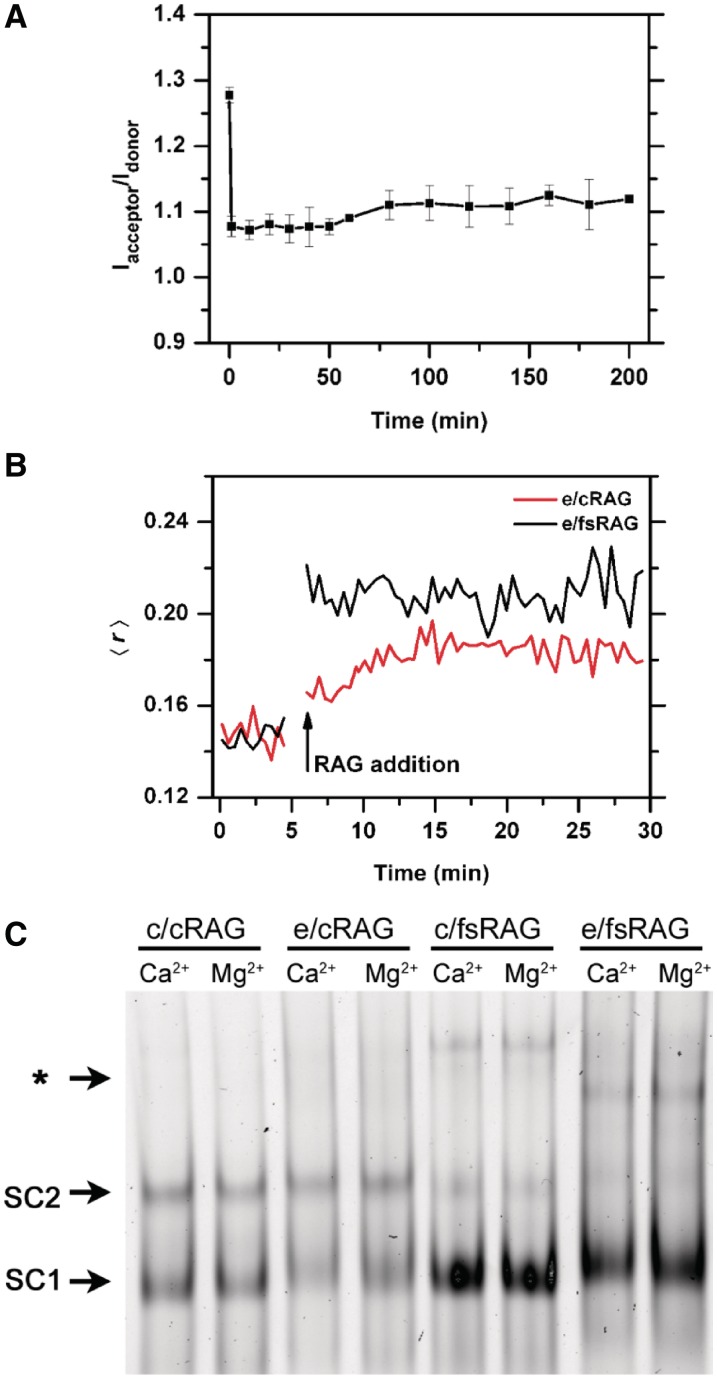
Figure 5.
Characteristics of RAG-RSS interactions induced by fsRAG2. (A) FRET profile of RAG-12RSS interactions induced by e/fsRAG in Ca2+. (B) Fluorescence anisotropy of TAMRA-12RSS before and after the addition of e/cRAG (red) or e/fsRAG. (black). (C) Gel mobility shift assay (EMSA) analysis of the TAMRA-12RSS with various RAG combinations in the presence of Ca2+ or Mg2+. The various reactions, after being assembled at 37°C for 0.5–1 min, were immediately analyzed by EMSA, in which only the shifted DNA–protein complexes, but not the free probe, are shown here. The arrows point to SC1 and SC2 RAG–RSS complexes, as well as some slower mobility complexes denoted by asterisk.

