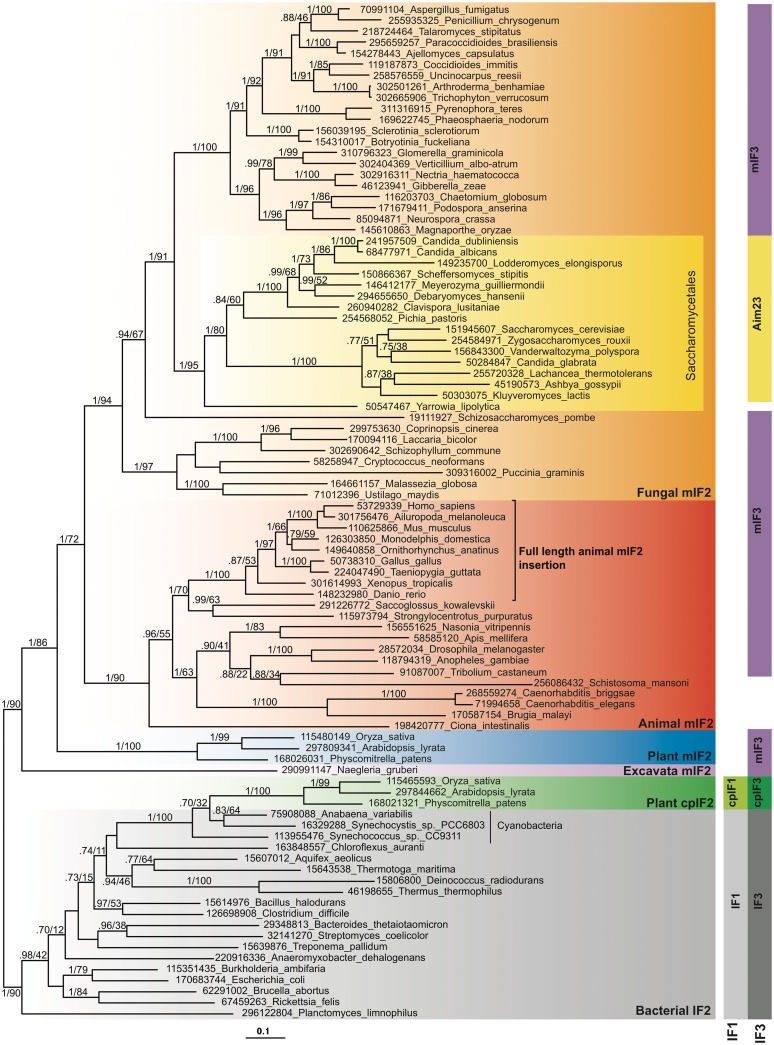
Figure 1.
Phylogenetic tree of mitochondrial IF2 (mIF2), bacterial IF2 and chloroplast IF2 (cpIF2). The tree is a MrBayes consensus tree, generated from 405 aligned amino acids. The standard deviation of split frequencies at the end of the MrBayes run was 0.018. Bayesian inference posterior probability (BIPP) and maximum likelihood bootstrap percentage (MLBP) support are indicated on branches. Only branches with >0.70 BIPP support are labelled with BIPP and MLPP values. The scale bar below the tree shows the evolutionary distance expressed as substitutions per site. Numbers in taxon names are NCBI GI numbers. Vertical blocks show the distribution of IF1, mitochondrial IF1 (mIF1), chloroplast IF1 (cpIF1), IF3, mitochondrial IF3 (mIF3), Aim23p and chloroplast IF3 (cpIF3). Blocks in the same column indicate orthologous proteins. The black bracket shows the taxonomic boundary of the full-length conserved animal IF2 insertion.

