Figure 6.
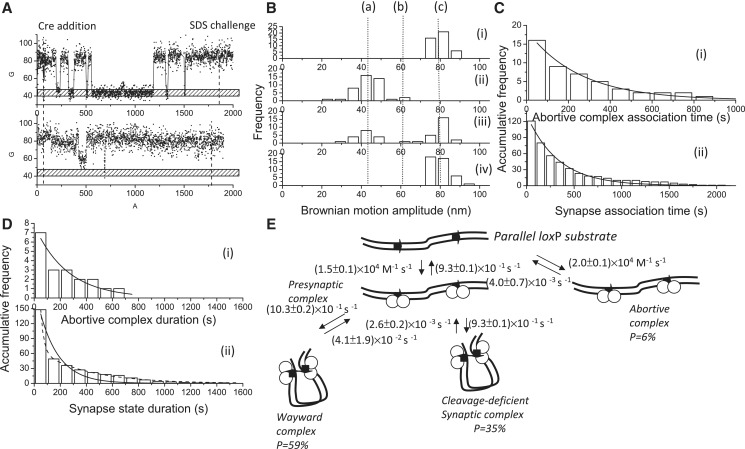
Complex formation and recombination events for 1267 bp DNA molecules containing parallel loxP sites mediated by cleavage-deficient CreK201A. (A) (i)–(ii) A change in the BM amplitude of 1267 bp DNA molecules containing parallel loxP sites in response to the addition of CreK201A. (i) An example of a molecule that synapsed but failed to continue to the recombination process. (ii) An example of a molecule that failed to synapse within the duration of the observations. (B) (i) The distribution of the BM amplitude before the addition of Cre recombinase, with an average value of 78.8 ± 10.2 nm, which is indicated with (c). (ii) The distribution of the BM amplitude in response to the addition of Cre recombinase (61.0 ± 1.3 nm and 44.0 ± 12.0 nm for the abortive complex state and the synapse state, marked with (b) and (a), respectively). (iii) The distribution of the BM amplitude at 30 min of incubation time. (iv) The distribution of the BM amplitude in response to the SDS challenge at 30 min of incubation time (n = 43). (C) The distribution of the dwell times between recombinase addition and the change in the BM amplitude to (i) a value that represented the abortive complex state and an association rate constant of (2.0 ± 0.1) × 104 M−1 s−1 (R2 = 0.98, n = 16) and to (ii) a value that represented the synapse state and an association rate constant of (1.5 ± 0.1) × 104 M−1 s−1 (R2 = 0.98, n = 121) were obtained. The data were fitted to a single exponential decay algorithm (Origin 8.0). The N mentioned above is the number of molecules observed. (D) (i) The dwell times in the abortive complex state for the DNA molecules containing parallel loxP sites that failed to synapse during the observations were pooled and then fitted to a single exponential decay algorithm [R2 = 0.98, τ1 = (4.0 ± 0.7) × 10−3 s−1, n = 7]. (ii) The distribution of the dwell times in the synapse state was fitted to either a single exponential decay algorithm [R2 = 0.98, k1 = (6.8 ± 0.8) × 10−3 s−1, n = 148] or a bi-exponential decay algorithm [R2 = 1.00, k1 = (4.1 ± 1.9) × 10−2 s−1, A1 = 0.90; k2 = (2.6 ± 0.2) × 10−3 s−1, A2 = 0.10, n = 148]. Solid and dashed lines represent single and bi-exponential fitting curves, respectively. The N mentioned above is the number of events observed. The error is within the 95% CL. (E) The mechanism through which bacteriophage P1 CreK201A mediates site-specific recombination. The arrows on the DNA molecule indicate the parallel loxP sites. The empty circles represent Cre recombinases. The arrows on the DNA molecule indicate the parallel loxP sites.

