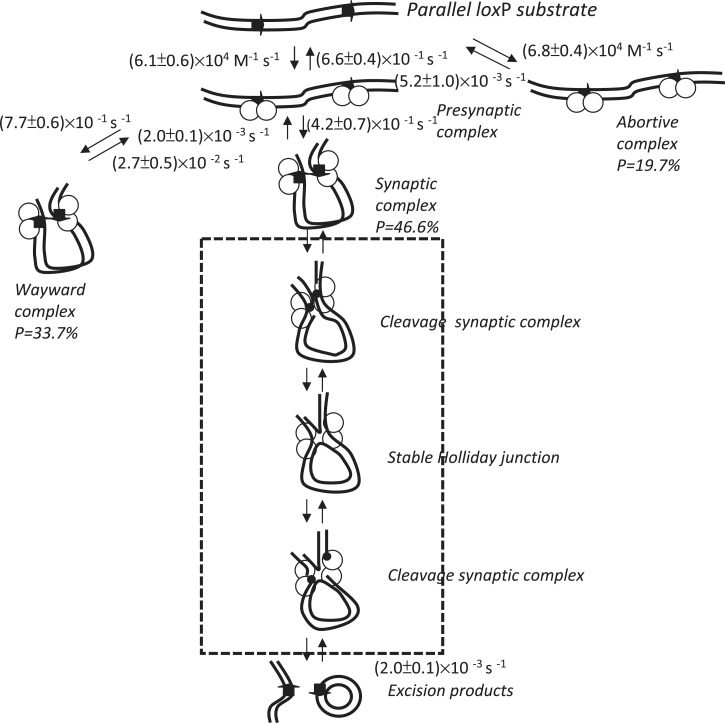
Figure 7.
Mechanism by which bacteriophage P1 Cre recombinase mediates site-specific recombination. The rate constant for each step was obtained via either single exponential decay fitting or bi-exponential decay fitting to the duration distribution histograms. The arrows on the DNA molecule indicate the parallel loxP sites. The empty circles represent the Cre recombinases. The small black dots represent the covalent phosphotyrosine linkage that is created after DNA cleavage. All the processes within the frame—from strand cleavage to strand migration to strand ligation—were assigned as catalytic recombination processes.

