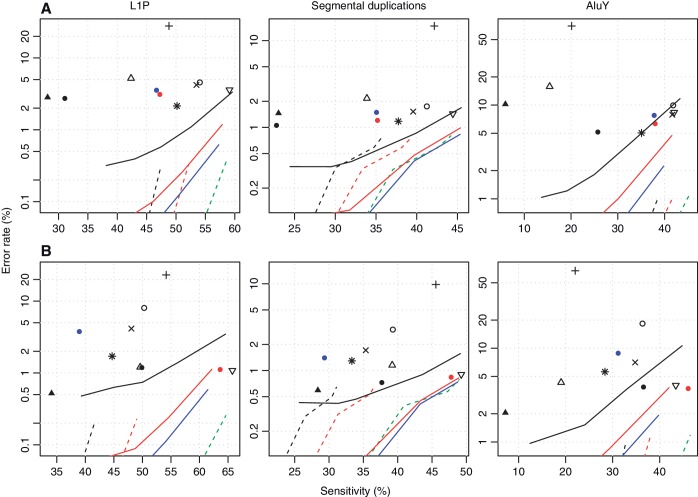
Figure 5.
Accuracy of various methods for aligning bisulfite-converted DNA reads to recent duplications in the genome. The upper row shows results for dataset (A), and the lower row for dataset (B). The left-most column shows results for L1P elements, the middle column for segmental duplications and the right-most column for AluY elements. The sensitivity is the percentage of reads from within duplicated regions that were correctly aligned. The error rate is the percentage of reads aligned within duplicated regions that were wrongly aligned. Each symbol and line refers to a different alignment method: see the key in Figure 2.

