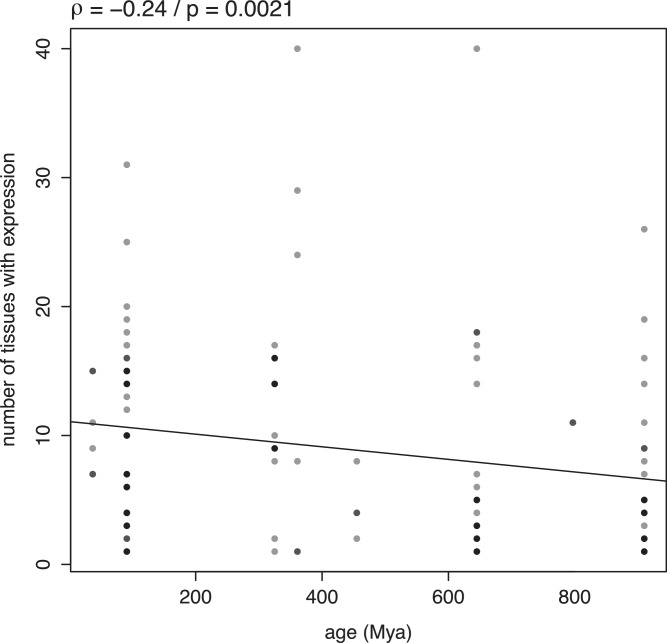
Figure 3.
Relation between the age of miRNA genes and their breadth of expression. Relation between the age of miRNA genes and the number of anatomical structures in which they are expressed in mouse. The number of structures showing expression of miRNA genes was assessed using in situ hybridization data. The linear regression line is plotted. Darker dots in the plot result from the superposition of several data points.

