
Figure 4.
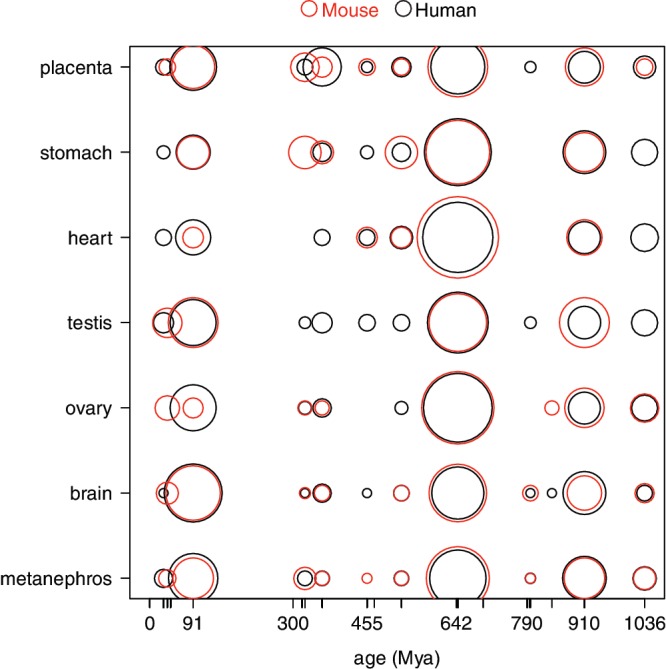
Comparison of miRNAs expression in human and mouse. Comparison of the number of miRNA genes of different ages expressed in human (black circles) and mouse (red circles) in different homologous tissues (HOGs). The surface of the circles is proportional to the number of miRNA found expressed, normalized by the total number of miRNA genes expressed in the different tissues considered for each species.