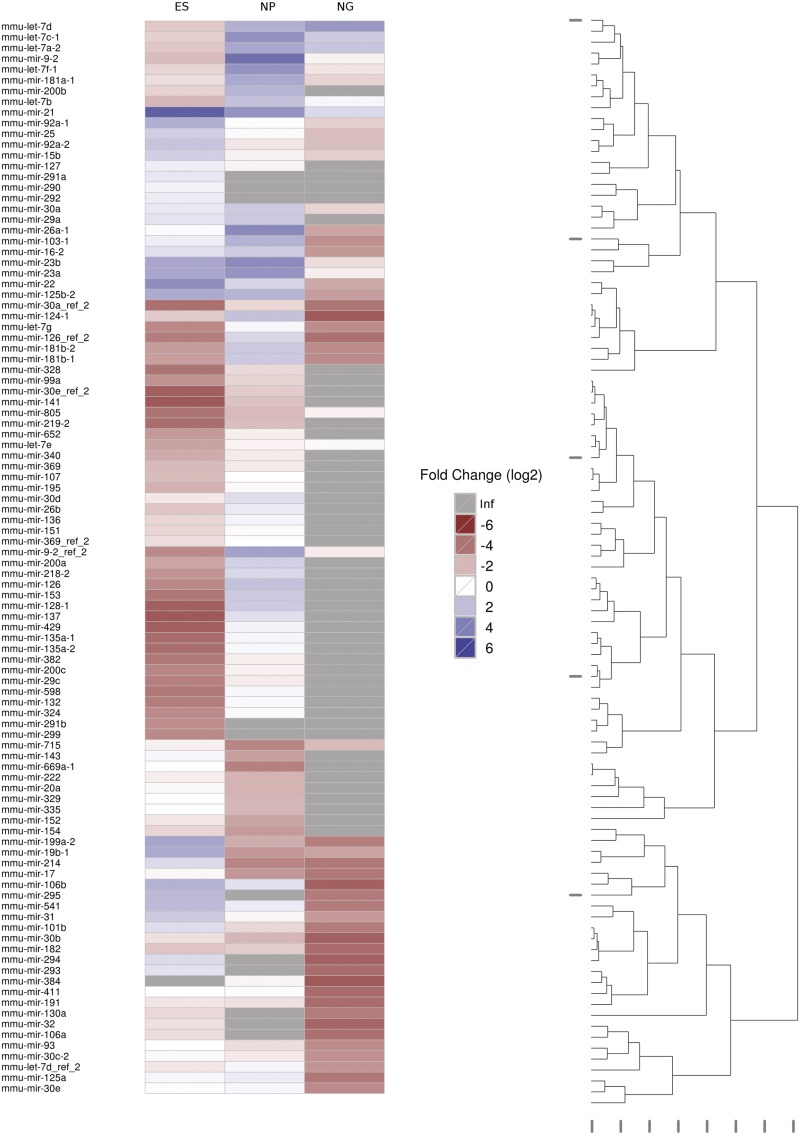
Figure 2.
The 100 most differentially expressed miRNAs. Expression values were normalized against the mean expression value (257.6). Fold changes are depicted in a log2 scale. Inf: infinite fold-change because expression was not detectable in the respective library. The dendrogram to the right indicates the Euclidean distance of the expression values.

