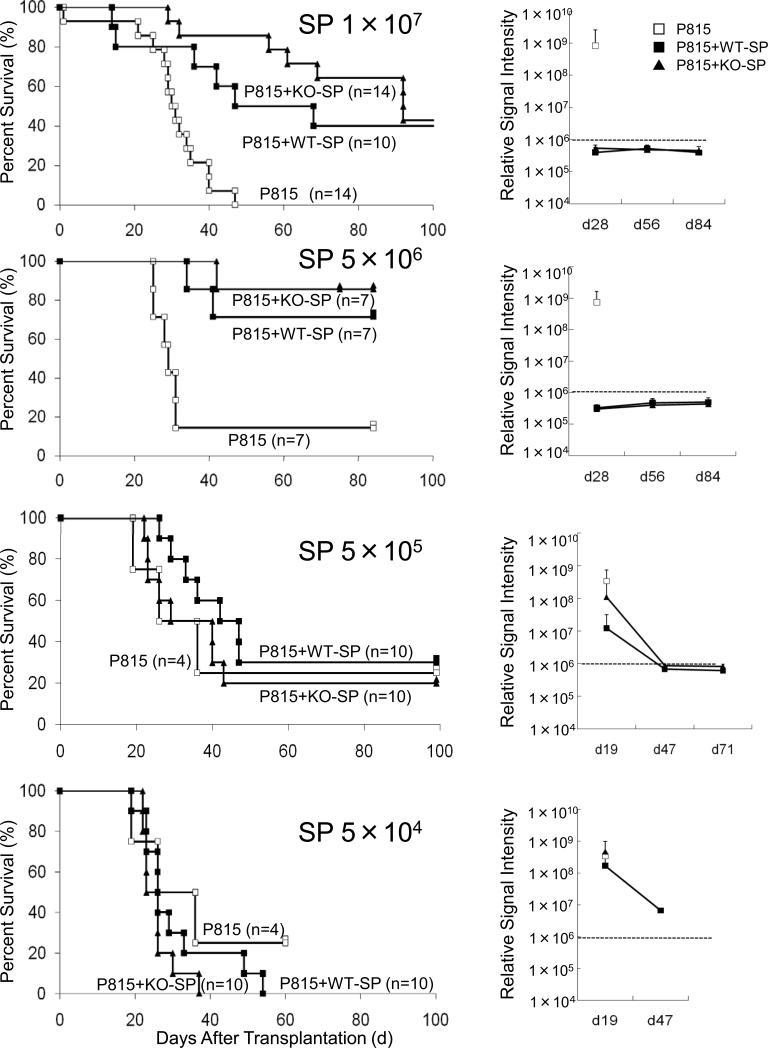
Figure 5.
Survival curve and leukemic-tumor-burden in dose-reduction transplantation with bulk splenocytes. C57BL/6-DBA2 F1 recipients were transplanted with 2 × 10⁴ P815 leukemic cells expressing luciferase (H-2d), 5 × 10⁶ TCD-BM (H-2b), and 1 × 10⁷ WT-SP or KO-SP (H-2b). Then, the dose of bulk splenocytes was reduced to 5 × 10⁶, 5 × 10⁵, and 5 × 10⁴. Open squares, filled squares, and filled triangles indicate transplantations without splenocytes, with WT-SP, and with KO-SP, respectively. Right panels indicate the average of signal intensity of luminescence in survivors at indicated days after transplantation, which correlates with leukemic-tumor-burden. Empirically determined positive-negative threshold indicated in broken line was 106 relative signal intensity per mouse.

