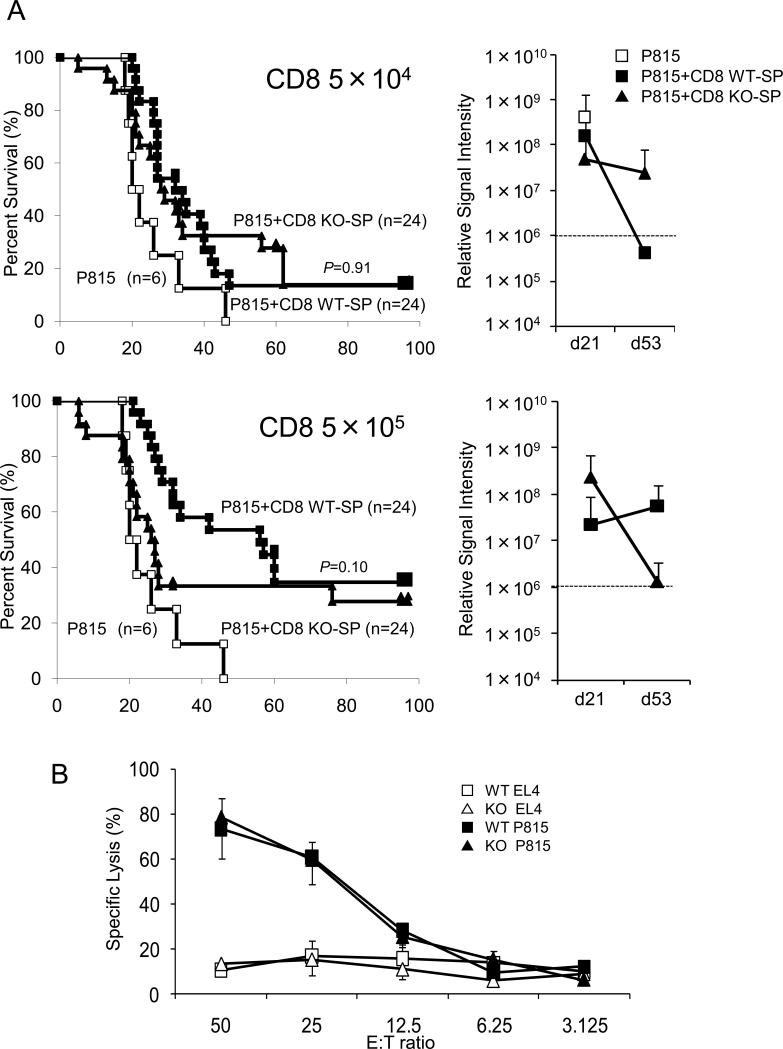
Figure 7.
Survival curve in dose-reduction experiments with CD8-purified splenocytes and cytotoxic T cell assay. (A) Experiments were the same as in Fig. 5, but the donor cells were CD8-purified splenocytes. The doses of purified CD8 T cells were 5 × 10⁴ and 5 × 10⁵. Open squares, filled squares, and filled triangles indicate transplantations without splenocytes, with CD8 purified WT-SP, and with CD8 purified KO-SP, respectively. Right panels indicate the average of signal intensity of luminescence in survivors at indicated days after transplantation. (B) 51Cr release assay. Two weeks after co-transplantation with splenocytes from either KO or WT mice, splenocytes from recipient C57BL/6-DBA-2 F1 mice were incubated with 51Cr-preloaded allogeneic (P815, H-2d) and syngeneic (EL4, H-2b) target cells. Specific lysis was calculated as follows: (sample count – background) / (maximum count – background) (%). Error bars are ± S.E.M.

