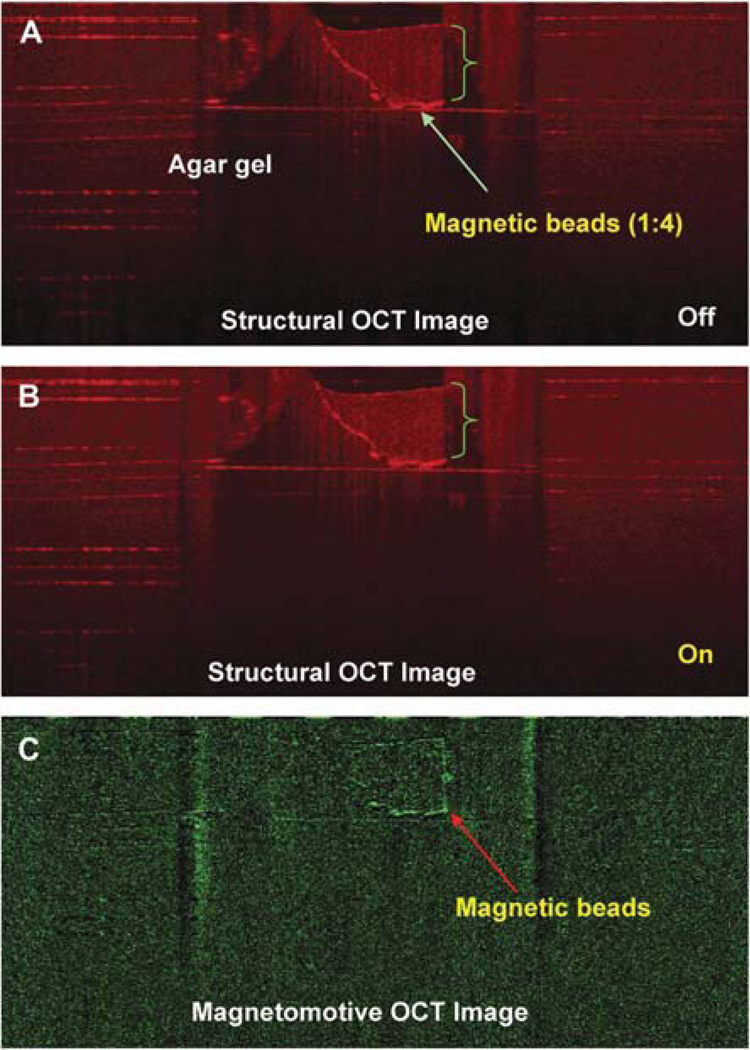
FIG. 4.
Magnetomotive OCT image of magnetic beads at a dilution of 1:4. The beads (green bracket) were diluted 1:4 with normal saline and injected into an agarose gel (1.5% agarose in 400 mM Tris acetate, 10 mM ethylenediaminetetraacetic acid). The OCT images were acquired before (A) and after (B) switching on the magnetic modulation. The magnetomotive OCT image (C) shows the boundaries of the magnetic beads.

