
Fig. 5.
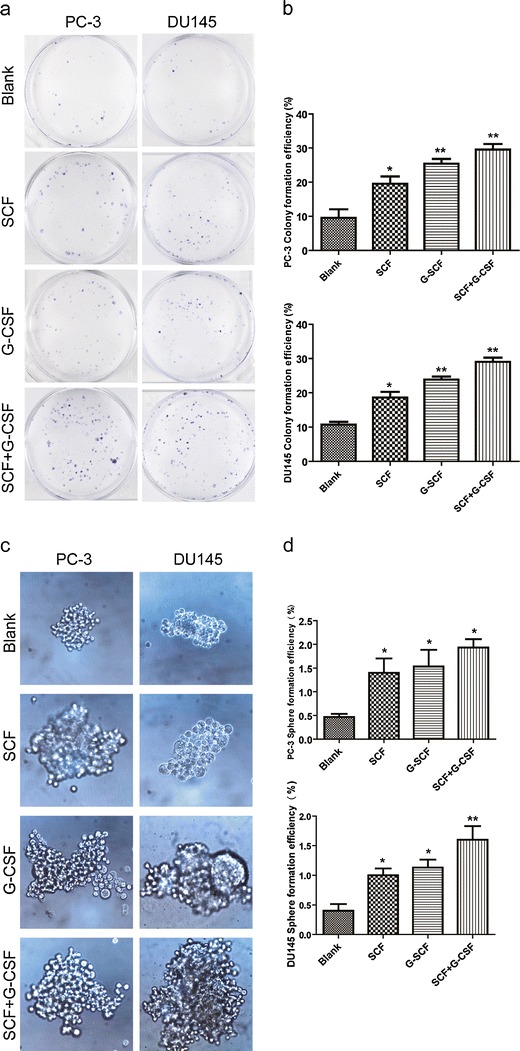
Colony formation and sphere formation analyses. a Representative photographs of colony formation show more colonies in the cells treated with either SCF or G-CSF and even more colonies in the cells treated with both cytokines in PC-3 and DU145 cell lines. b Histograms demonstrate higher colony formation efficiency in the cells treated with either SCF or G-CSF and even higher colony formation efficiency in the cells treated with both. c Representative views of sphere formation in PC-3 and DU145 cell lines with/without cytokine treatments. d Histograms show higher sphere formation efficiency in the cells treated with either SCF or G-CSF and even higher sphere formation efficiency in the cells stimulated with both SCF and G-CSF (Asterisk means P < 0.05 vs. blank control; double asterisks means P < 0.01 vs. blank control)