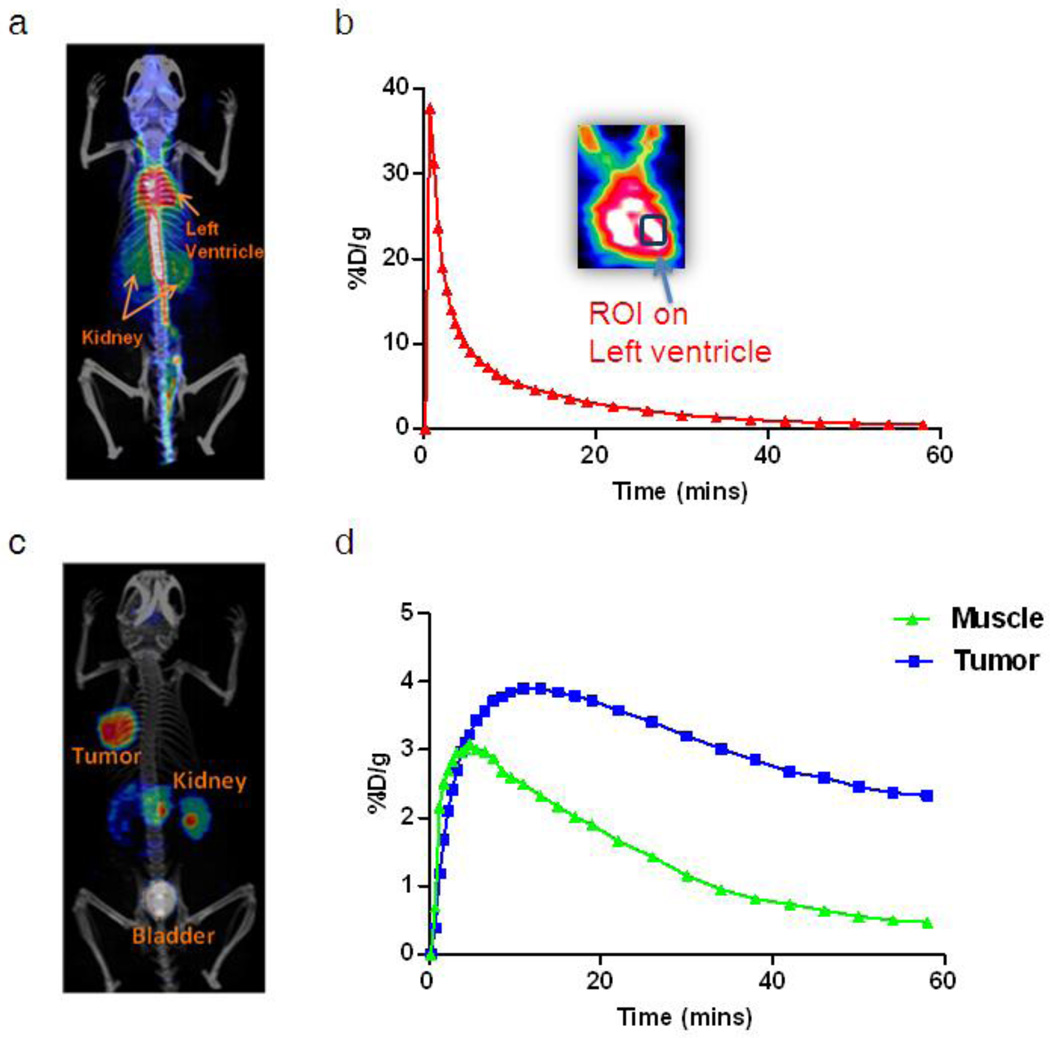
Fig. 2.
a A representative PET/CT fusion 2D projection image at 0.5 min (the second frame of dynamic PET image series). b A blood time activity curve is extracted by drawing a region of interest over the left ventricle. c A representative PET/CT fusion 2D projection image at 60 min (the last frame of dynamic PET image series). d Time activity curves corresponding to the regions of tumor and muscle.

