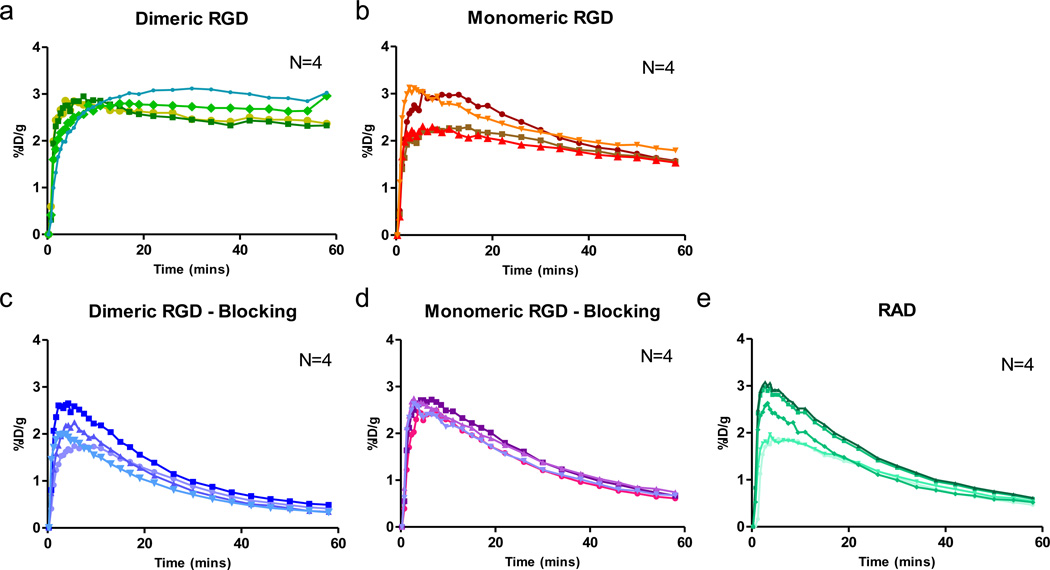
Fig. 3.
Tumor time-activity curves derived from 60-min dynamic PET scans for (a) unblocked group of mice after administration of dimeric RGD peptide tracer 18F-FPPRGD2, (b) unblocked group of monomeric RGD peptide tracer 18F-FPRGD, (c) blocked group of dimeric RGD, (d) blocked group of monomeric RGD, and (e) 18F-FPRAD control. (n = 4/group).

