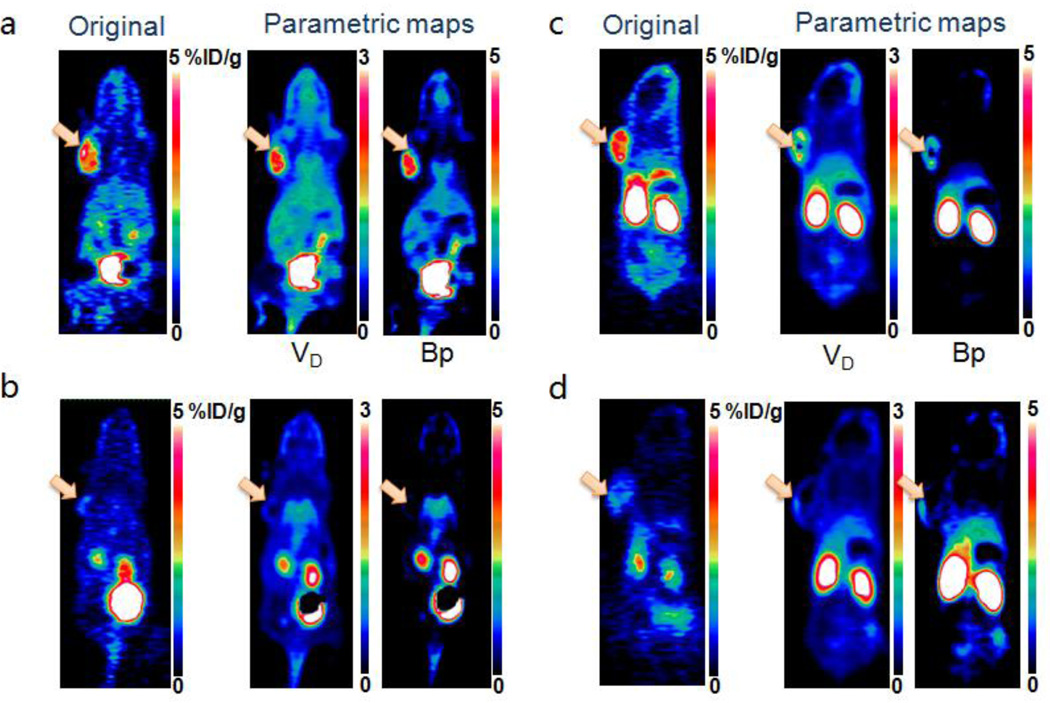
Fig. 6.
(a, b) Representative original static PET images at 60 min (left), parametric maps of volume of distribution (middle) and binding potential (right) for unblocked (a) and blocked (b) groups of mice after administration of dimeric RGD peptide tracer 18F-FPPRGD2. (c, d) Representative original static PET images at 60 min (left), parametric maps of volume of distribution (middle) and binding potential (right) for unblocking (c) and blocking (d) groups of mice after administration of monomeric RGD peptide tracer 18F-FPRGD. The arrows point to tumors.

