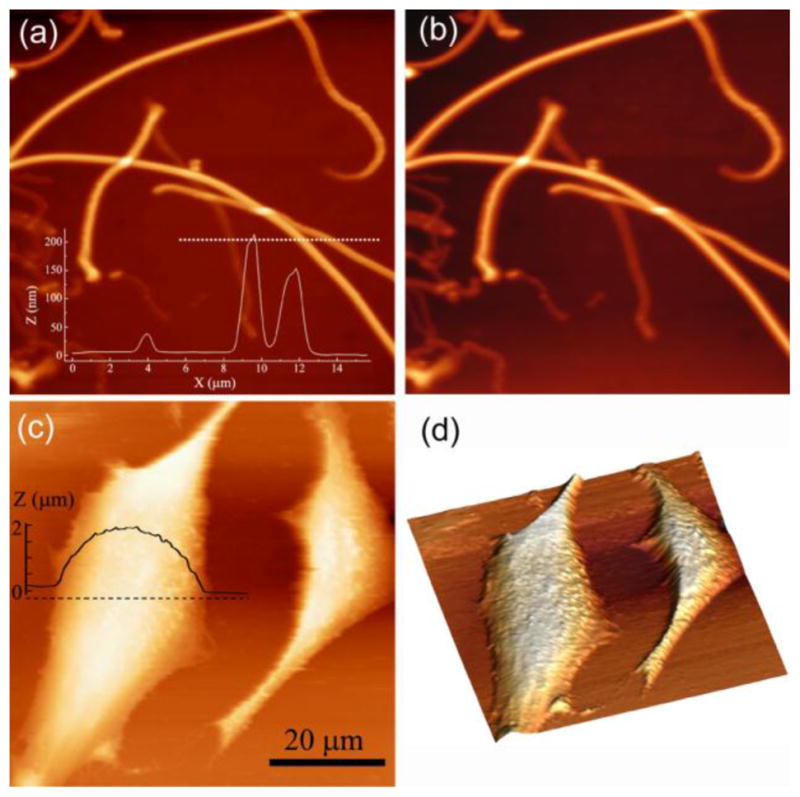
Fig. 4.

(a–b) AFM images of type I collagen fibrils acquired in ethylene glycol. AFM topographical image acquired at a drive amplitude of 10 nm (a) and 1 nm (b). Overlaid in (a) is the height plotted along the dotted line marked in (a). The scan size is 30 μm × 30 μm. (c) AFM topographical imaging of living HeLa cells in physiological conditions showing minimal cell membrane deformation. Overlaid in (c) is the corresponding height profile acquired along the dashed line marked over the cell. (d) The corresponding 3-D representation of the cell topography in (c). The scan rate for AFM imaging is 1 Hz.
