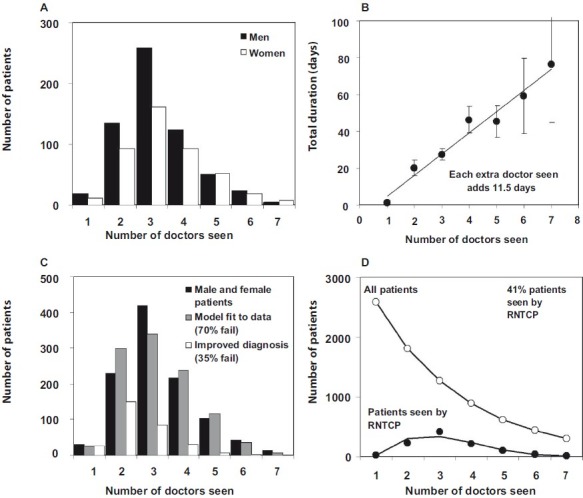
Fig. 2.

A. The number of doctors seen by 1049 male and female patients in Bangalore (mode 3, range 1-7), as reported to the RNTCP. B. Cumulative duration of health system delays in relation to the number of doctors seen. The slope of the line indicates that each doctor seen adds 11.5 days to the diagnostic delay. C. Fit of model 1 (grey) to the total number of male and female patients (black), assuming a failure rate at each point (and survival to visit the next doctor), f, of 0.7. The alignment of black and grey bars indicates a good fit of the model to the data. Open bars show the distribution of the number of doctors seen if a new diagnostic procedure reduced f to 0.35. D. Fit (lower line) to the data (filled circles) in A and C, and the estimated total number of patients (open circles) in this setting in Bangalore. Data from the study by Pantoja et al15.
