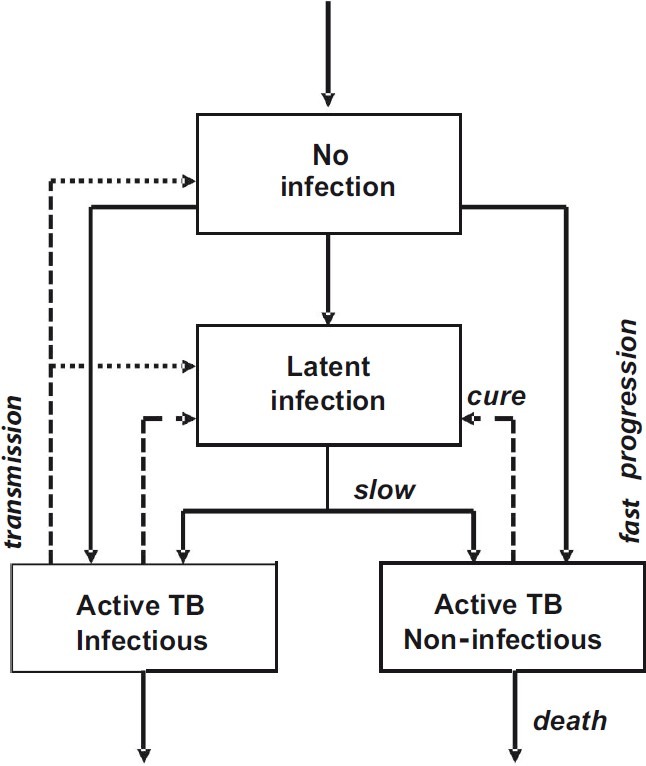
Fig. 3.

Stock and flow chart of the TB transmission model. Transmission (dotted arrow) drives the direction of movement (solid arrows) among exclusive groups of uninfected and infected people. Infection can progress quickly to active infectious or non-infectious TB, or slowly via a subclinical or latent state. Patients with active TB who are successfully diagnosed and treated are returned to the latent state (dashed arrows); otherwise they persist in the population with active disease, or die. Equations of the model are in the Annexure and parameter values are in the Table.
