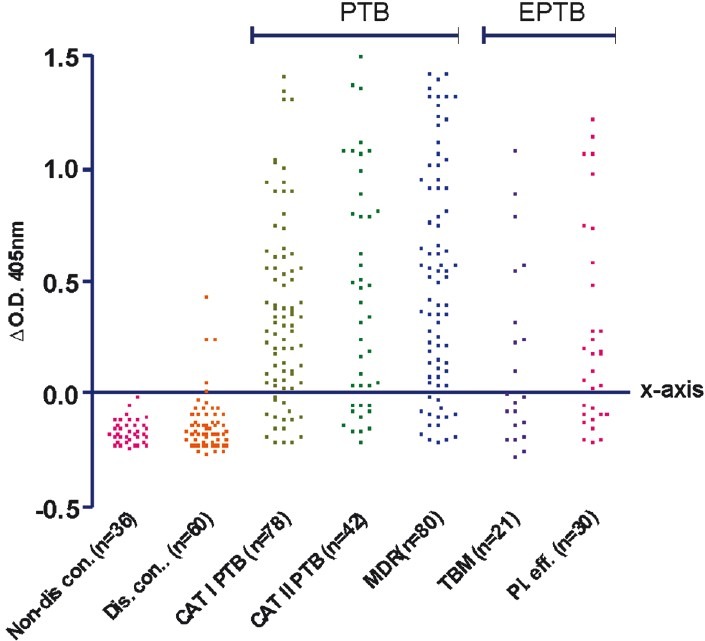
Fig. 1.

(I): Scatter plot of humoral responses in serum samples of non-disease controls, disease controls, category I PTB, category II PTB, MDR-TB, tuberculous meningitis (TBM) and tubercular pleural effusion patients. Each dot represents the ΔO.D. (ΔO.D. = O.D. of sample – cut-off value) for individual patient. All dots above X-axis are positive O.Ds. All dots below X-axis are negative O.Ds.
