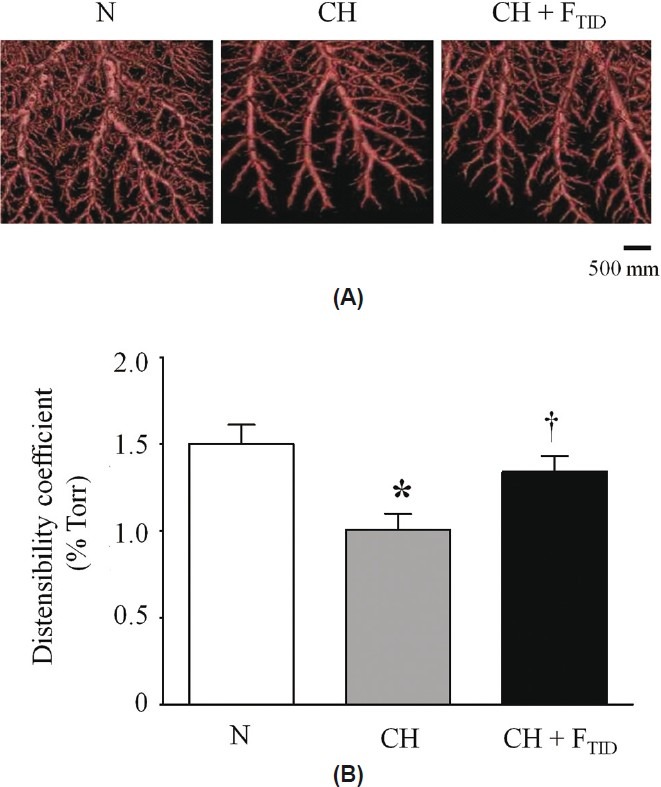
Figure 3.

(A) Computer-generated three-dimensional images of pulmonary arterial trees from neonatal piglets exposed for 3 weeks to normoxia (N), chronic hypoxia (CH) or chronic hypoxia + furegrelate three times daily (CH + FTID). (B) Comparison of distensibility coefficients between the pulmonary circulations of N, CH and CH + FTID piglets. Sample sizes were 15, 7 and 6, respectively. *Significant difference (P<0.05) between N and CH. †Significant difference (P<0.05) between CH and CH + FTID. Values are mean±S.E.M.
