
Figure 1.
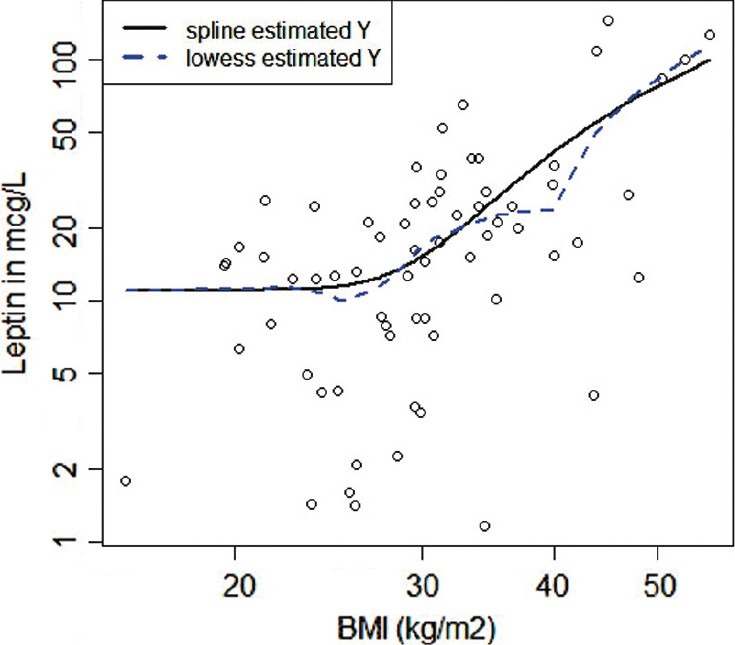
Scatterplot of leptin level and BMI. Both axes in the plot are logged. Restrictive cubic spline (black, solid) and Lowess (gray, dash) lines are displayed.
Official websites use .gov
A
.gov website belongs to an official
government organization in the United States.
Secure .gov websites use HTTPS
A lock (
) or https:// means you've safely
connected to the .gov website. Share sensitive
information only on official, secure websites.
Scatterplot of leptin level and BMI. Both axes in the plot are logged. Restrictive cubic spline (black, solid) and Lowess (gray, dash) lines are displayed.