
Figure 2.
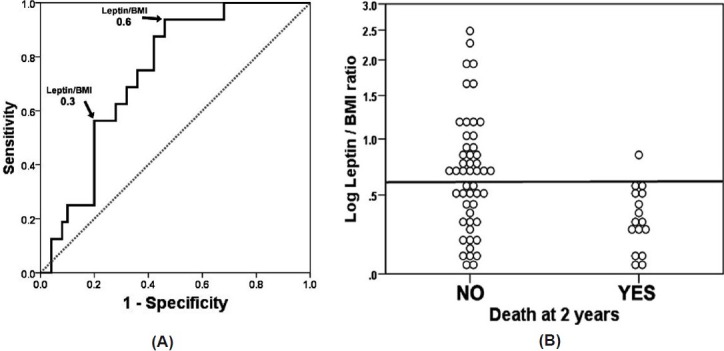
ROC curve of leptin/BMI and dot chart of log leptin/BMI with mortality at 2 years as the classification variable. (A) leptin/BMI measurements are in μg * m2/ kg * l. Area under the curve: 0.74 (95% CI: 0.62-0.86). (B) Dot chart of log leptin/BMI with line placed at a leptin/BMI ratio of 0.6. All but one of PAH patients who died at 2 years had a leptin/BMI ratio <0.6.