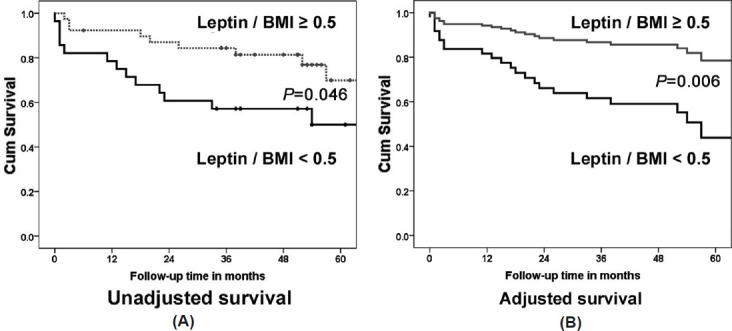
Figure 3.

Survival analysis. Kaplan–Meier survival analysis with log-rank test comparing the ratio of leptin/BMI <0.5 and ≥ 0.5 μg * m2/ kg * l (A) and Cox regression analysis using the same cut-off of leptin/BMI adjusted for age, gender, BMI, and smoking status (B).
