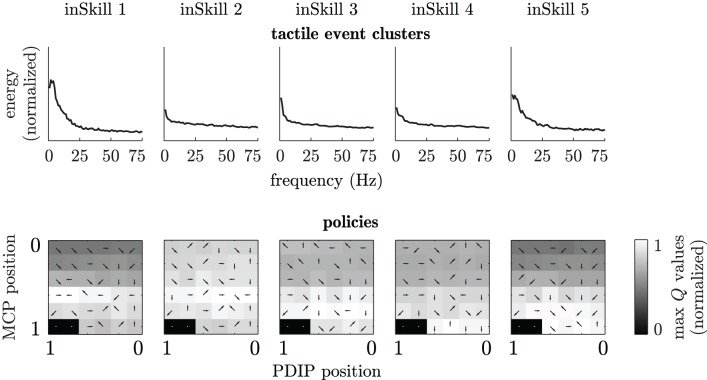
Figure 10.
InSkill sensory clusters and policies after 100 learning episodes in a setup with the coarse textile. Top row: frequency-spectra cluster means of each inSkill. Bottom row: normalized maximum Q-values for each module (grayscale) and best actions (arrows). States and actions are the same as in Figure 8. Black areas without arrows indicate states that were never sampled during learning.

