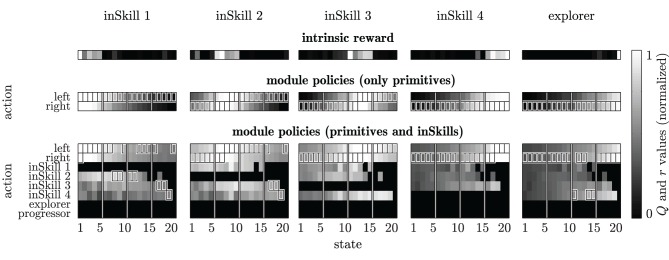
Figure 3.
Intrinsic rewards and module policies after 200 learning episodes in the restricted chain walk environment. Top row: normalized intrinsic reward for each module as a function of the reinforcement learning state s′. Middle row: Q-tables for modules that can select only primitive actions, with Q-values (grayscale) maximum values (boxes) and the abstractor's cluster boundaries (vertical lines). Bottom row: Q-tables for modules that can select both primitive actions and inSkills. Black areas in the Q-tables indicate state-action pairs that were never sampled during learning. Each column of plots shows the results for an individual module.

