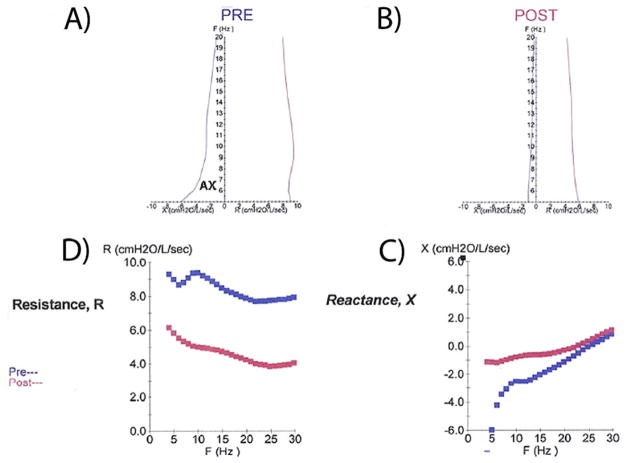
Figure 2.
Representative graphical report of IOS testing. A and B, Composite plot developed by Goldman10 illustrates both resistance, R, and reactance, X, as a function of Freq (Hz) before bronchodilator (A) and postbronchodilator (B). AX is the area under the curve of reactance. C and D, The same curves displayed separately as pre and post R (C) and X (D).

