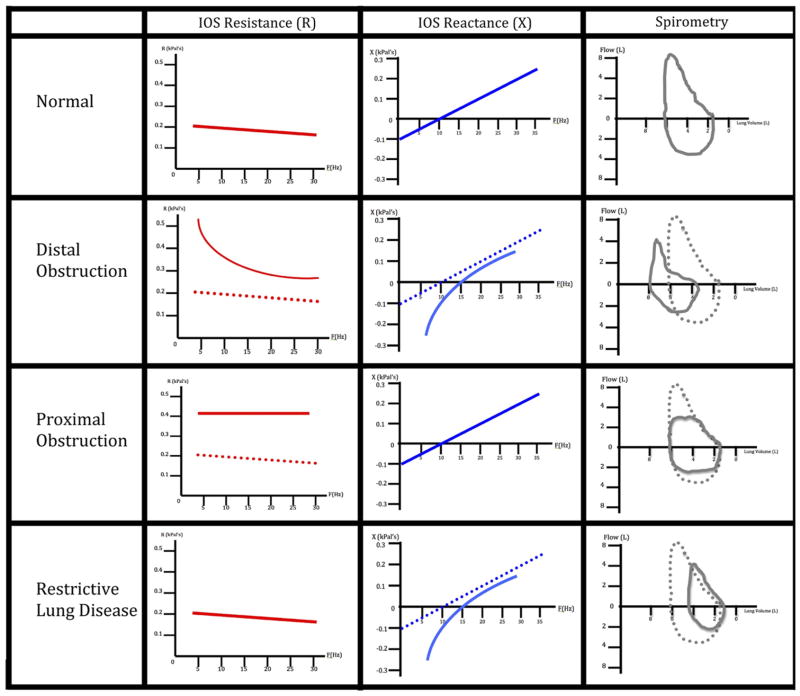
Figure 3.
Representative graphs of IOS and spirometry in patients with normal, obstructive, and restrictive lung disease. Tracings of lung resistance and reactance in comparison with spirometric flow-volume loop for prototypical patients with normal lung function, distal obstruction, proximal obstruction, and restrictive lung disease. Dotted lines indicate the normal tracing, whereas solid lines show pathological tracings.

