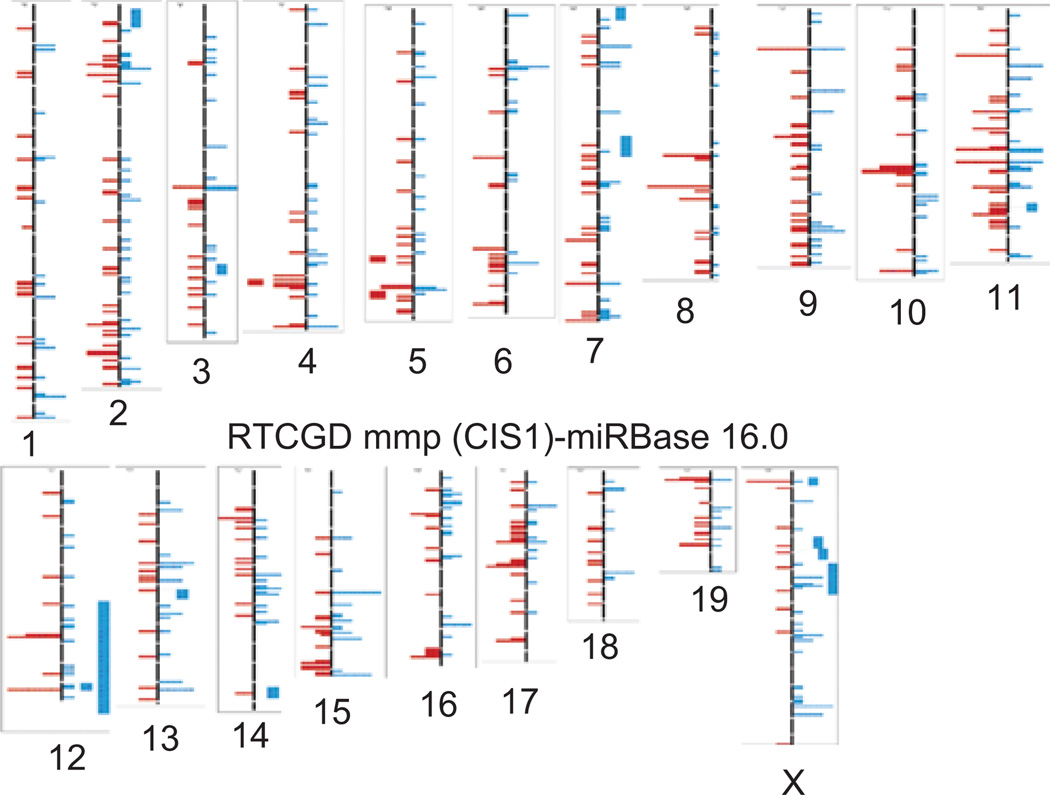
Figure 2.
Low-resolution representation of the CIS-1 data analysis. Shown are the retroviral integration sites (left side of chromosome), miRNA locations (right side of chromosome) for the RTCGD and miRBase 16.0 as described for CIS-1. Mouse chromosomes are numbered accordingly and sized accurately. For high-resolution analysis of CIS-1, CIS-2, and CIS-3 in comparison with miRNA positioning, please contact huppi@helix.nih.gov.

