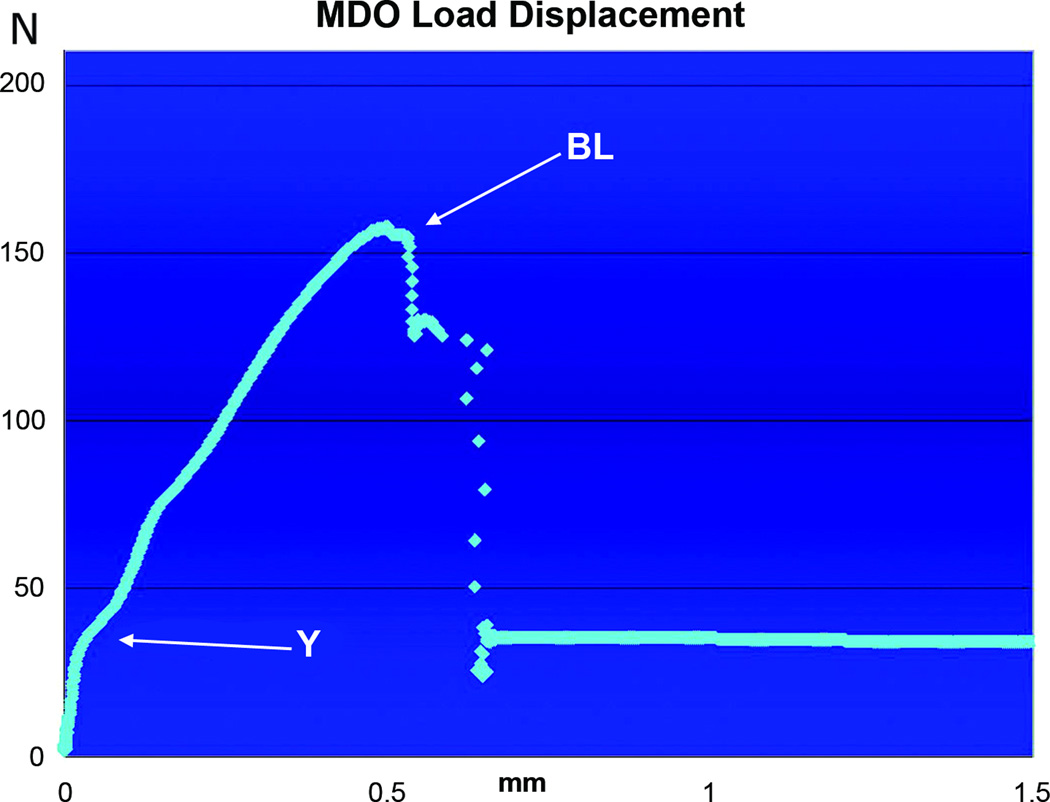
Figure 5.
LD curve of MDO tension tested to failure with the X-axis representing mm of displacement, with the Y-axis representing Newtons (N) of force. For this specimen, the Yield (~36Newtons) occurs at a displacement of 0.035mm, while the BL (~157Newtons) occurs here along the X-axis at 0.5mm (MDO displacement ranges from 0.4 – 0.6mm).

