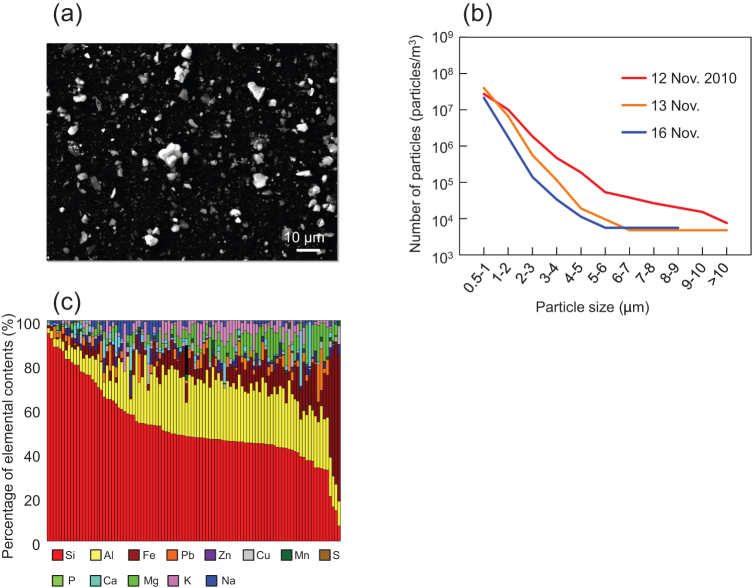
Figure 1.
(a) Scanning electron micrograph of Asian dust particles collected on 12 Nov. 2010. (b) Size distribution of Asian dust particles collected on 12 Nov. 2010. Size of each dust particle was determined by image analysis of scanning electron micrographs and 20,000 to 100,000 particles were analyzed in each sample. (c) Elemental composition of Asian dust particles (size: 1 to 5 μm) determined by energy dispersive X-ray analysis. 100 dust particles collected on 12 Nov. 2010 were analyzed. Each bar represents one of the 100 dust particles.

