
Figure 1. Mutation frequencies in human CRC.
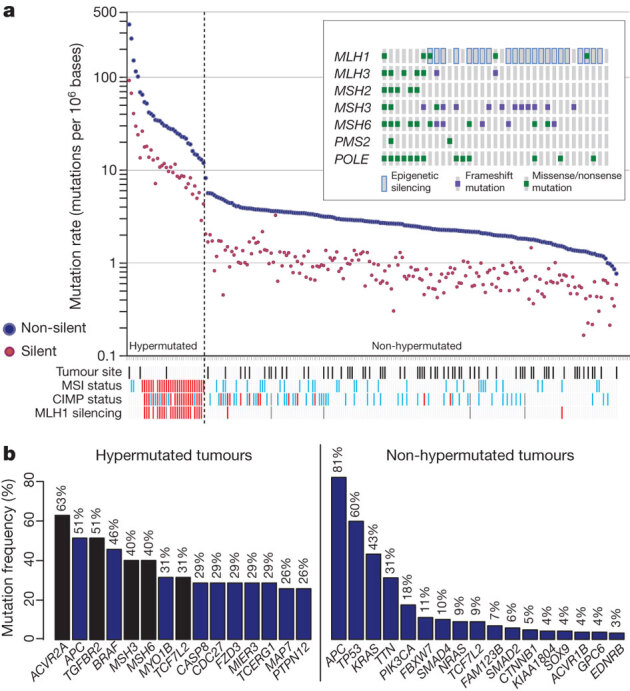
a, Mutation frequencies in each of the tumour samples from 224 patients. Note a clear separation of hypermutated and non-hypermutated samples. Red, MSI high, CIMP high or MLH1 silenced; light blue, MSI low, or CIMP low; black, rectum; white, colon; grey, no data. Inset, mutations in mismatch-repair genes and POLE among the hypermutated samples. The order of the samples is the same as in the main graph. b, Significantly mutated genes in hypermutated and non-hypermutated tumours. Blue bars represent genes identified by the MutSig algorithm and black bars represent genes identified by manual examination of sequence data.