
Figure 3. Copy-number changes and structural aberrations in CRC.
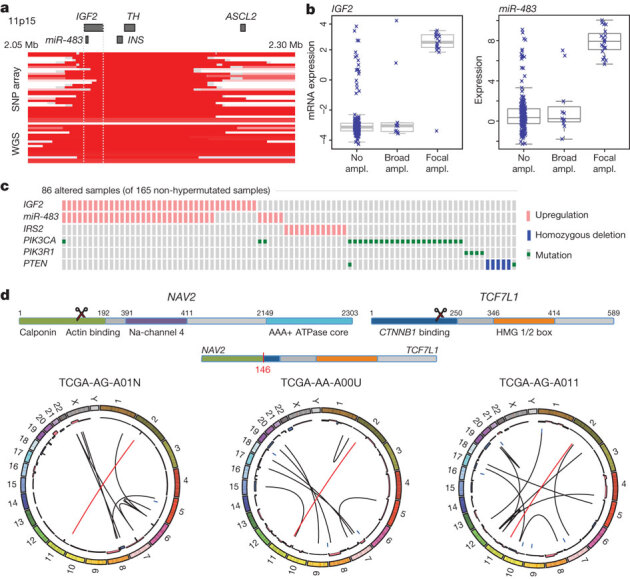
a, Focal amplification of 11p15.5. Segmented DNA copy-number data from single-nucleotide polymorphism (SNP) arrays and low-pass whole-genome sequencing (WGS) are shown. Each row represents a patient; amplified regions are shown in red. b, Correlation of expression levels with copy-number changes for IGF2 and miR-483. c, IGF2 amplification and overexpression are mutually exclusive of alterations in PI3K signalling-related genes. d, Recurrent NAV2–TCF7L2 fusions. The structure of the two genes, locations of the breakpoints leading to the translocation and circular representations of all rearrangements in tumours with a fusion are shown. Red line lines represent the NAV2–TCF7L2 fusions and black lines represent other rearrangements. The inner ring represents copy-number changes (blue denotes loss, pink denotes gain).