
Figure 4. Diversity and frequency of genetic changes leading to deregulation of signalling pathways in CRC.
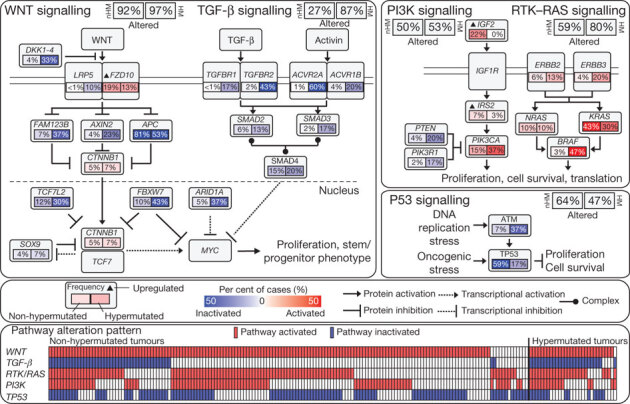
Non-hypermutated (nHM; n = 165) and hypermutated (HM; n = 30) samples with complete data were analysed separately. Alterations are defined by somatic mutations, homozygous deletions, high-level focal amplifications, and, in some cases, by significant up- or downregulation of gene expression (IGF2, FZD10, SMAD4). Alteration frequencies are expressed as a percentage of all cases. Red denotes activated genes and blue denotes inactivated genes. Bottom panel shows for each sample if at least one gene in each of the five pathways described in this figure is altered.