
Figure 5. Integrative analyses of multiple data sets.
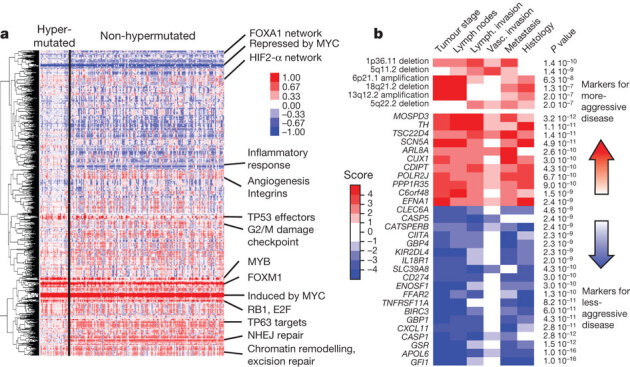
a, Clustering of genes and pathways affected in colon and rectum tumours deduced by PARADIGM analysis. Blue denotes under-expressed relative to normal and red denotes overexpressed relative to normal. Some of the pathways deduced by this method are shown on the right. NHEJ, non-homologous end joining. b, Gene-expression signatures and SCNAs associated with tumour aggression. Molecular signatures (rows) that show a statistically significant association with tumour aggressiveness according to selected clinical assays (columns) are shown in colour, with red indicating markers of tumour aggressiveness and blue indicating the markers of less-aggressive tumours. Significance is based on the combined P value from the weighted Fisher’s method, corrected for multiple testing. Colour intensity and score is in accordance with the strength of an individual clinical–molecular association, and is proportional to log10(P), where P is the P value for that association. To limit the vertical extent of the figure, gene-expression signatures are restricted to a combined P value of P < 10−9 and SCNAs to P < 10−7, and features are shown only if they are also significant in the subset of non-MSI-H samples (the analysis was performed separately on the full data as well as on the MSI-H and non-MSI-H subgroups).