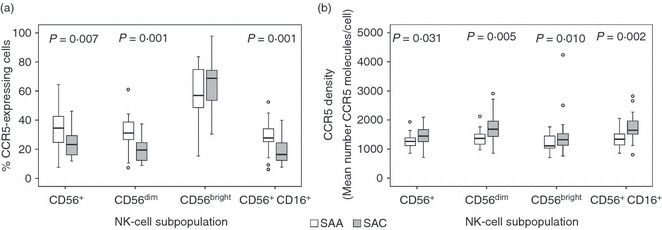
Figure 1.

CCR5 expression in South African African (SAA; n = 22) and South African Caucasian (SAC; n = 24) individuals within natural killer (NK) cell subsets. (a) Percentage of CCR5-expressing cells within NK-cell subsets. (b) CCR5 density on CCR5-expressing NK-cell subsets. Heterozygous CCR5Δ32 individuals have been excluded. Box-whisker plots depicting the median (horizontal black line), 25th and 75th centiles (margins of the box) and the 10th and 90th centiles (whiskers). Outliers are indicated with (○). Where significant, P-values have been indicated.
