Figure 4.

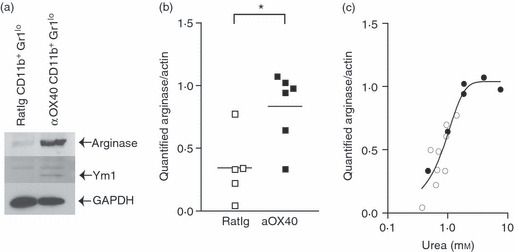
(a) MCA205 cells were injected subcutaneously in C57BL/6 mice and allowed to grow to 5–7 mm in diameter (approximately day 10). Mice were injected intraperitoneally with 250 μg αOX40 or control RatIg and after 7 days the tumour was removed, tumour-infiltrating cells were sorted by FACS to purify CD11b+ Gr1lo IAhi populations, and these cells were lysed and Western blotted for arginase, Ym1 and GAPDH expression. (b) Tumour-infiltrating cells were harvested as in (a), then the adherent macrophage population from individual tumours (> 90% CD11b+ by FACS analysis) was lysed and Western blotted using antibodies specific for arginase, then stripped and reprobed with antibodies specific for actin. Graph shows quantification of arginase bands standardized to actin expression. Each symbol represents the data from one tumour-bearing animal. (c) Lysates of tumour macrophages from (b) were tested for arginase enzyme activity by conversion of l-arginine to urea, and compared to a standard curve of known urea concentration by colorimetric assay. The graph correlates quantified arginase expression levels by Western blot to arginase enzyme activity in macrophages from mice treated with RatIg (open circles) or αOX40 (closed circles). Each symbol represents the data from one tumour-bearing animal. *P < 0·05.
