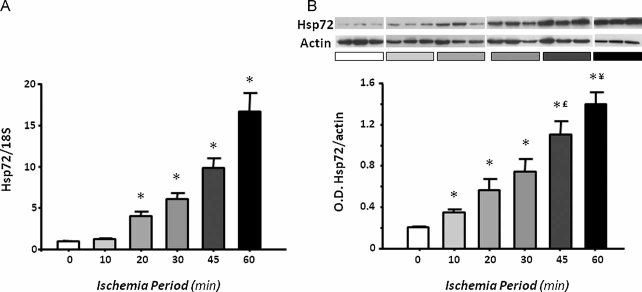
Figure 3. Renal Hsp72 expression in rats subjected to different periods of ischemia.
- Total RNA was individually extracted from the renal cortex of all studied groups (n = 5) and Hsp72 mRNA levels were determined by real time RT-PCR.
- Renal cortex proteins were individually extracted from three rats of each group, and Hsp72 protein levels were assessed by western blot. Upper inset shows a representative image of the autoradiography of the membrane and the lower graph depicts densitometric analyses of the ratio of Hsp72 to β-actin. *p < 0.05 versus sham-operated rats, £p < 0.05 versus 30 min and ¥p < 0.05 versus 45 min of ischemia group.

