
Figure 4. Urinary Hsp72 mRNA and protein levels from rats subjected to different periods of ischemia.
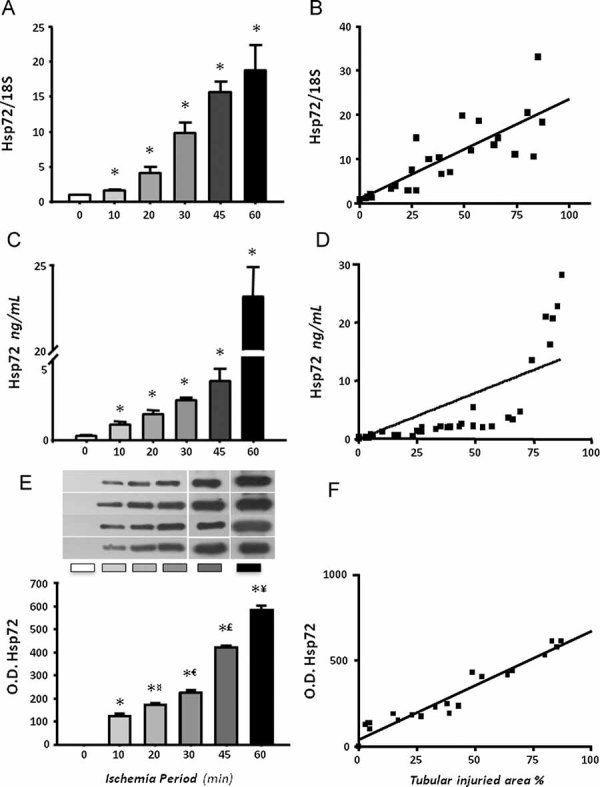
- Total RNA was individually extracted from the urine of six rats per group and Hsp72 mRNA levels were determined by real time RT-PCR.
- Relationship between mRNA levels and tubular affected area.
- Urinary Hsp72 levels assessed by ELISA.
- Relationship between urinary Hsp72 levels and the % of tubular affected area.
- Urinary Hsp72 levels assessed by WB analysis from four rats of each group.
- Relationship between urinary Hsp72 levels detected by WB and tubular injured area. *p < 0.05 versus sham-operated rats, ¤p < 0.05 versus 10 min, €p < 0.05 versus 20 min, £p < 0.05 versus 30 min and ¥p < 0.05 versus 45 min of ischemia group.