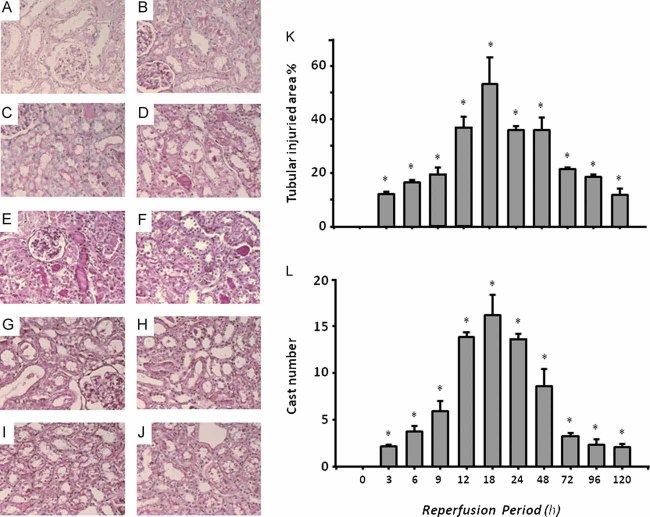
Figure 5. Representative images and morphometry of subcortical histopathological lesions induced by 30 min of ischemia and different periods of reperfusion.
- 3 h
- 6 h
- 9 h
- 12 h
- 18 h
- 24 h
- 48 h
- 72 h
- 96 h and
- 120 h of reperfusion.
- Morphometric quantification of affected tubular area.
- Mean cast number per field *p < 0.05 versus sham-operated rats.

