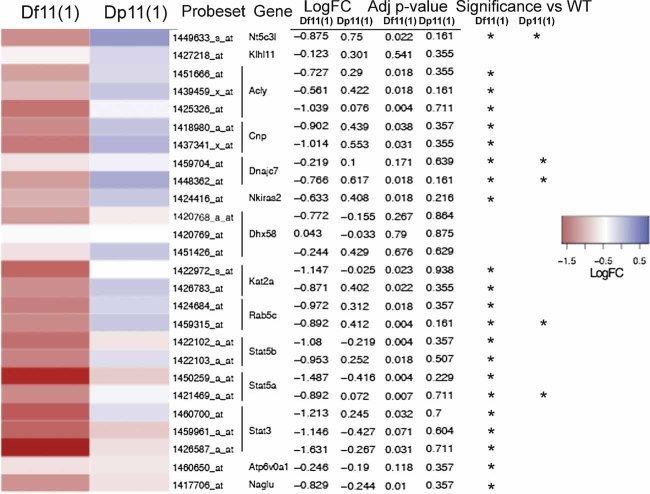
Figure 3. Gene expression changes.
Microarray hybridization analysis of expression patterns of genes within the rearrangement demonstrated changes in expression consistent with gene dosage. A heat map shows the normalized expression of genes in the Df11(1)/+ versus WT and Dp11(1)/+ versus WT samples. Average of two microarray experiments per sample (log2 ratio for each gene was scaled with mean = 0 and SD = 1; log fold change and adjusted p values are indicated). Genes with a significant change in expression level are indicated (*p < 0.25).

